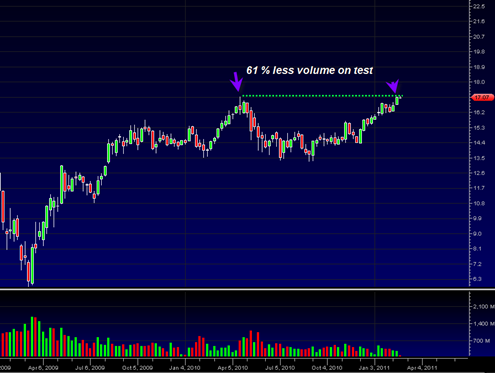
The XLF Financial Select Sector SPDR (ETF) weekly candlestick price chart shows no major bearish candlestick pattern, however the volume picture does not inspire very much confidence.
The XLF is only just now revisiting its April 2010 high level after most other indices have exceeded it by an already large margin. The advancing volume on the rally in most indices has not been inspiring either.
But now we see that last weeks weekly price candlestick hit a price high of 17.13 and the total weekly volume was 272 million shares. So this weekly price candle tested the April 12, 2010 price candle on 61% less volume because the volume of the April 12, 2010 price candle was 704 million shares.
This 61% drop in volume is not a very bullish sign for this index in terms of the volume picture. The price is acting strong however. It will be interesting to see if the XLF is able to overtake the previous mid April 2010 price swing.
If the XLF is to evolve bearishly then a good start to that scenario would be a decline into the end of this week that retraces the entire weekly bullish price candlestick of last week.


