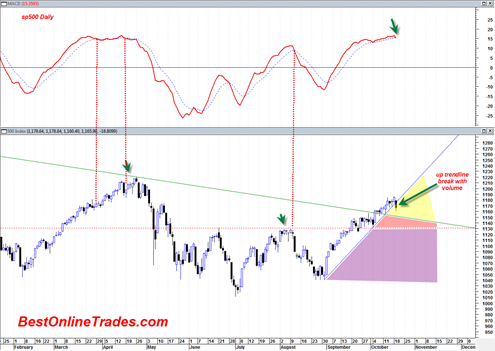
I went long the VXX and the SDS again today after being stopped out yesterday. As indicated in my previous post, the BOT short signal is now live again as of the open in the sp500 today which was 1178.64. I can really see very clearly how being short the market too early is such a dangerous position to be in especially if you are playing with leverage. It can become very expensive to pick the top until one has valid confirmation. Today looks like clear confirmation to me. I am about 80/20 confident now that this is the top (80% confident we made the final top/ with 20% of me still looking for more confirmation).
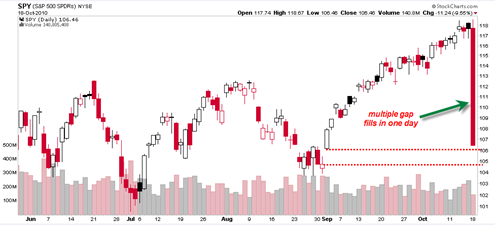
I find it quite interesting that we had another mini flash crash in the SPY on 10/18 yesterday. Of course it is already explained away by the authorities but I cannot help but think that this SPY mini flash crash is sort of an ‘indicator’ for what could be coming in the next few weeks.
Someone over at the traders-talk message board indicated that on May 5, 2010 there was a similar ‘bad tick’ on the SPY. I have no idea if this is true and cannot verify it, but if it is true then it is almost as if that May 5,2010 bad tick on the SPY was the warning shot that predicted the actual May 6, 2010 real drop. I am just speculating here as I don’t have data or hard facts on whether or not May 5, 2010 actually had such a bad tick on the SPY. Also interesting from the bad tick chart of the SPY above I find it interesting that this huge down move almost fully engulfed the entire advance since early September which had many run away gaps (and even more gaps on the Nasdaq Composite). And there is that huge gap between 104.50 and 106 which looks like it needs to be filled. I don’t know if we are going to retrace the entire September 2010 rally, but what I do know is that this rally that began in early September was on ‘fumes’ in terms of average volume. Low volume rallies in an illiquid market without enough retail traders can lead to very fast downward retracements.
Today the sp500 finally showed a sign of weakness both in terms of price spread and volume. Key in the interpretation is that we saw a wide downward price spread with heavy volume right off of the highs. This is never a good condition for any stock or market index especially when one considers that the average volume of the previous 4 to 6 week rally was the lowest of the previous 3 major rallies since April 2010.
The summation index is starting to curl over more significantly now. At issue is how long this top will take to fully complete itself before we start to see a real downward rollover. One cannot rule out a further 5 to 10 days of saw tooth type price action that forms before we are able to get some real downside momentum going. So we are either going to form something similar to the April 2010 topping formation or the early August 2010 topping formation. Clearly April 2010 top was much more labored before the market finally gave up. The early August 2010 top was about 7 trading days whereas the April 2010 top was about double that.
I am seeing a good amount of topping formations in many individual stocks and bearish divergences between MACD histogram and price. Of course each one is in a different stance and each will take time to rollover before finally giving up. This describes a potential waterfall decline type situation over the next few weeks with the worst of it likely occurring in the last 1/3 of the time with today as the starting point. It could be that we are looking at a 20 to 25 trading day decline phase going forward. How many of those days are deep decline days depends a lot on how much longer the market tops out right here.
The chart above shows that we have broken into the yellow shaded warning zone the depicts a break of the September rally up trend line support. A break into the red zone would be much more bearish as it would shows this recent breakout was a false breakout above the 2007 bear market resistance line. Then a break into the purple shaded area would ‘put a fork in it’ so to speak since it would be a violation of critical support and issue a massive 2B sell signal likely taking the market down to 1035.
But I do not want to get too far ahead of myself here. One step at a time. There are levels to be broken here or that will hold support. These battles will be won or lost in the days ahead. The average volume calculation starting with today’s price will be an important clue as to whether this market will have enough energy to bust into the red and purple shaded areas in the chart above.
The two green arrows on the left side of the chart show the topping formations duration on previous important peaks. It remains to be seen how long this topping process will take to form before the real downside occurs.
I am doing a post after this one on General Electric which I think has provided some important clues on the recent sp500 break down.


I saw that exact tick last night. when i was reviewing my position. Someone cashed in just before AAPL and IBM maybe??