I can come up with a Million Reasons why the Market Should go Down

But the problem is I am just a tiny water droplet and the market itself is an entire ocean.  The market could care less what I think and it will do exactly what it wants to do on its own time.

I have done a number of posts on what appear to be good reasons for a near term bearish resolution in price behavior for the sp500 and most other major broad market indices.  But despite that recent bias, I have to pinch myself and at least consider a bullish possibility for the market going into the long Easter holiday weekend.

By many measures the market is overbought.  But a market just being overbought is sometimes not enough of a reason for it to decline.  It can continue into ‘tilt mode’ overbought before any meaningful price reversal occurs.

The jobs report is coming out this Friday.  There will be no trading that day.  So whatever the results are of that report will have 3 full days to build up and stew over the long weekend.  That 3 day rest period before a market reaction usually leads to a very big opening move to start the following week.  And the market as of late has a very strong habit of being up on Mondays.

But everything seems to be relying on the interpretation of Friday’s jobs report.  Most of the news lately has been good news and it just seems to keep on coming, so why should this Friday be any different ?

I can speculate until I am blue in the face and will still not be able to figure out how the market will react on Monday of next week.

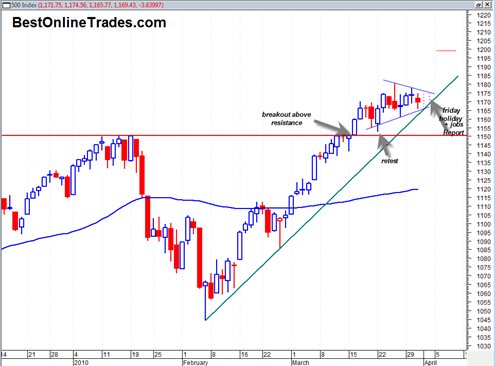
So here are the cold hard facts based on the chart:

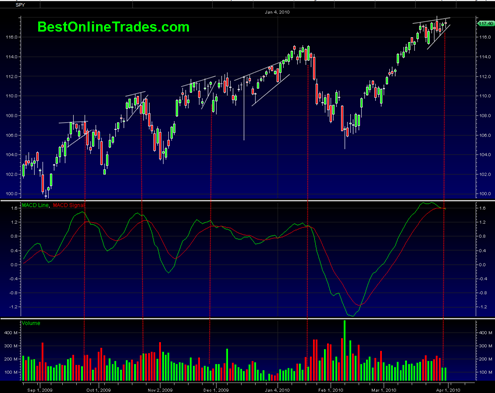
sp50020100401 

The SP500 since early February has been in a very strong uptrend.  In early March it broke out above a significant resistance line with a moderate sign of strength and then attempted to retest the breakout area a few days later.

Read more

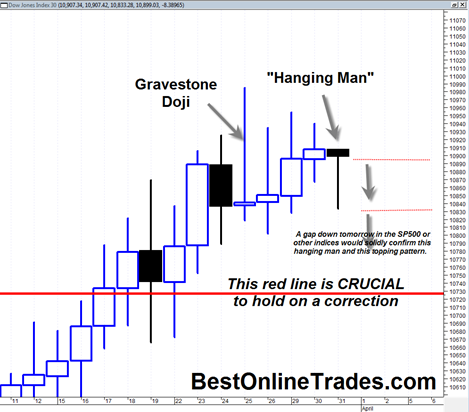
Dow Jones Industrial Average and SP500 show Hanging Man Candlestick

Breaking news development… The Dow Jones Industrial Average as well as the SP500 Index are currently as the time of this posting showing another potential bearish implication candlestick formation. The formation is the bearish hanging man candlestick.  This candlestick looks like a bullish hammer, has a small body shape and a tail that is at … Read more

The Stock Market Lions are Sleeping Today

AAAAAs_u3IkAAAAAAIDjiQToday was about as boring a day as I can remember in the stock market.  In fact it seems like it is Christmas 2010 already or the day before the new year.  You give me a dollar and I will give you a dollar back, and then we do that about a thousand more times.  That pretty much sums it up for today.

I attempted to go long LVS Las Vegas Sands Corp today but then got scared and jumped out within about 15 minutes.  I made that decision because of the volume non confirmation I mentioned in my previous post.  Today could have been the final low in Las Vegas Sands Corp before moving higher, but for now anyway I am going to stand aside.  I am just too nervous about the general market as a whole.  And honestly the ideal entry for LVS should have been way down near 16 and change.  That is where the MACD buy signal was generated and now the MACD is toppy and overbought.

So why didn’t I grab some LVS near 16 and change? Good question.  Probably because it was not jumping out at me at the time.  But that is always the tendency of the best buy setups, they are always quiet and not obvious at first.

I think I am scared money right now. I can’t help it.  I would rather not be too committed towards either side of the fence.  I would rather be right on the fence right now.

Read more

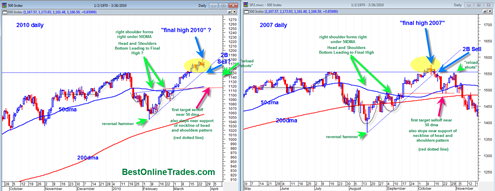
Is the 2007 Market Top in the SP500 trying to tell us something now ?

 spx20102007

There app ears to be a pretty solid chart pattern similarity between the 2007 sp500 market top and the current 2010 market structure.  The 2007 top was a slow grinding top and almost seemed like it happened in slow motion.

The current 2010 price action seems to have the same flavor with slow trickle up price action on generally weak volumes.  It is this slow and meandering price action that seems to lull a lot of people into complacency and forget that this market still has the potential to turn on a dime and transition into fast and furious downward price action.

But actually it would be incorrect to call the price action after the final high in 2007 as ‘fast and furious’.   It was still labored price action that marked the early stages of a much longer term decline.

Read more

iShares Lehman 20+ Year Treas.Bond Looks Extremely Bearish on Monthly Chart

tlt20100325

The iShares Lehman 20+ Year Treas.Bond monthly price chart looks very bearish to me right now and seems to be telling us that higher interest rates are coming in the months/year ahead.

The iShares Lehman 20+ Year Treas.Bond is showing a very large descending triangle pattern on the monthly chart after being stuck in a messy trading range for the last 10 months.  The last two days down volume was extremely heavy and in the near term is a telling sign of a possible continuation move as we go into the second quarter time frame.

We all know that the broad market averages do not like higher rates so this chart if eventually confirmed paints a picture of eventual pressure on stock prices.

It also seems to be saying that the US dollar Index will extend its northward move in the weeks/month ahead.

It seems like the whole world already knows about the US of A debt problems and the degree to which we are over extended in terms of our current borrowing and our ability to borrow any more.  But up until now it just seems that no one has had to pay the price for those excesses.  It seems as if no penalty or real crisis has evolved into something tangible yet.

Read more

Went long the TZA Direxion Daily Small Cp Bear 3X Shs 7.50 April Call Options

Today’s reversal candle was pretty nasty looking and serious enough for me to jump into the TZA Direxion Daily Small Cp Bear 3X Shs 7.50 April Call Options.  I will probably go long the TZA directly or some other inverse bear ETFS tomorrow.

This looks like an important top, but it is way too early for me to be talking about it being ‘the top’.  It could just be a swing trading type of top, but it looks serious. 

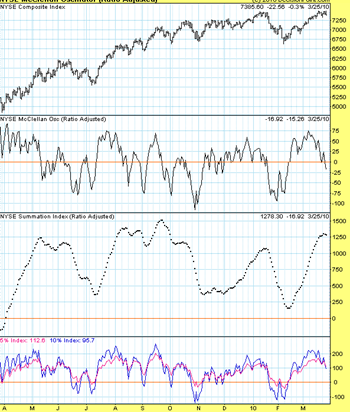
In addition the Mcclellan Oscillator looks very ominous as I see a double top in price of the New York Stock Exchange and an oscillator that looks ready for a steep decline.  Price usually follows the oscillator down.

mclellan20100325

It remains to be seen how well some of the stocks behave in the coming correction.  I just got done talking about how great LVS Las Vegas Sands looks, but if the market as a whole falls apart, LVS is going to have to the 20 level, otherwise a more complex correction could ensue and it would have created a false breakout.

Its funny how yesterday I was talking about not shorting this market until the 50 day crosses negatively down through the 200 day moving average… but then only a day later I am trying to be a hero calling a market top.  I guess it is just too tempting to try to nail an exact top because most of the ‘juice’ of the decline seems to happen in the first 20th percentile.

Read more