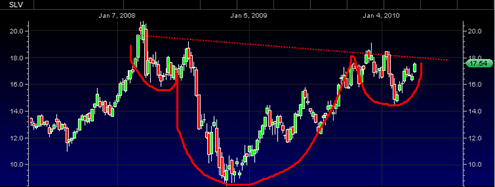
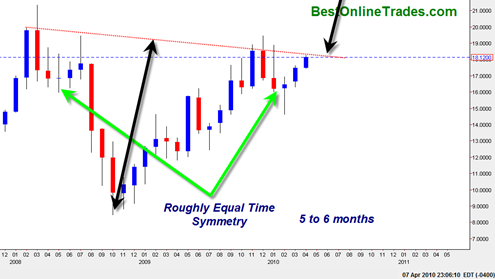
Silver Futures Looking Extremely Bullish next 6 to 12 months

If I am starting to sound somewhat repetitive, I am doing it on purpose.  Here at Best Online Trades I like to try to focus on the best risk reward scenarios at any given time.  Sometimes they are short term scenarios, other times longer term scenarios.

What has me very keen and interested right now is the precious metals sector.  And now even more so, the silver sector.  One of the most under rated and under covered sectors worldwide, the silver sector (which includes the silver price itself and the silver mining stocks) may be about to come more alive than any other sector in the market place.

The issue is though which is the best area of silver to participate in assuming a new strong bull leg is coming ?  My own personal take is that the AGQ ProShares Ultra Silver ETF is probably the best way to play the likely coming move in silver.  The AGQ is leveraged twice positively towards the silver price.  So if the silver price manages to make a 100% run in the next 1 to 1.5 years, then AGQ should perform close to 200%.

Now tell me where else in the next 12 to 18 months can you expect a 200% return? In the stock market ?  Bond Market ?  Real Estate?  Probably no, no and no again.

Individual silver mining stocks should get a good run going as well.  But since I have been watching the precious metals mining stocks since 2003 I can say that in general I have been usually disappointed in many or even most individual mining stocks performance relative to the metal itself or even ETFS.  There are just too many uncontrollable variables with the individual miners.  Why take all that extra risk when you have leveraged ETFs? I suppose it comes down to a question of greed since in some cases you will find individual mining stocks (juniors) go up by factors of 2, 5 or 10 of most other instruments.

Read more

My Quick Take On the 30 Dow Jones Industrial Average Stocks

-Ok here it goes… Alcoa Inc.  – Still in a decent uptrend but starting to look a little bit ‘labored’ American International Group, Inc. – Looking very bullish with recent breakout and big volume and RSI (Relative Strength Index) entering the ‘power zone. American Express Company – Recently rallied back up to previous 52 week … Read more

This may be the most amazing gold chart I have ever seen

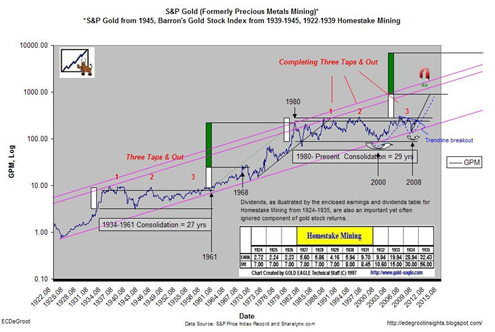
You really need to study this long term gold mining stock index chart.  It was sent to me by a buddy of mine and the chart was made by one of the regular blog posters over at www.jsmineset.com

It is a super long term gold mining stock index chart that goes all the way back to the 1920’s.  What absolutely blows my mind about this chart is that it shows that the GOLD MINING STOCK sector has still not really even had a breakout from the trading range that began in 1980 !!!

This is an amazing chart!

Read more

Timberline Resources Corp TLR starting to look bullish again as a trend trade

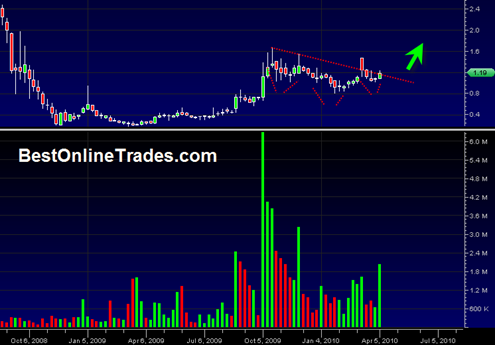
Timberline Resources Corp TLR chart is starting to look quite bullish to me again on both the daily and the weekly price chart.  I had talked about Timberline Resources Corp several other times in the past but it never really seemed to get anything done.

But now it has corrected along with the gold price and if I am correct that the gold price is getting close to shooting higher again, then TLR should eventually benefit from a nice gold price advance.

The problem with TLR is liquidity, somewhat spotty trading and a slow learning curve.  I suspect that even if the gold price does break out north, that Timberline Resources Corp  may take its own sweet time in getting a follow on break out.  That has been my experience with some of these junior gold stocks.

Still the chart structure looks good and it may be a nice position trade for the summer and into the end of 2010.

Read more

SPDR Gold Trust (ETF) warming up for a big move

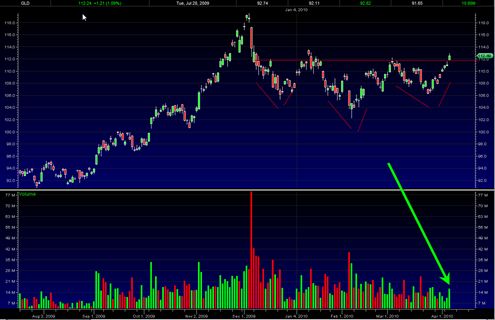
I suspect that a big move is coming in the gold price and the GLD ETF (SPDR Gold Trust).  Today gold behaved extremely well in the face of the first general stock market decline in over a month.

It could very well be that the gold price will begin to trade with relative strength to the stock market as the stock market is extremely overbought right now.  In fact I would not be surprised to see the stock market start to head south for the long awaited correction and then see the gold price zoom higher totally ignoring what the stock market does and even using a decline in paper assets as more fuel to the fire.

The daily and weekly charts on the gold price look outstanding and I continue to believe that right now…

Gold and Gold Shares are Much Better Risk Reward than the General Stock Market right now!

The reason for this is simple.  Gold has been in a corrective phase since early December 2009.  This is a long time by trading standards no matter what security or index we are talking about.  This consolidation time for gold has put it in a position to head higher regardless whether or not stocks keep going up or start a correction now.

The gold price has led the way in breaking out to new all time highs and the stock market has LAGGED the way trying to catch up to the gold price but so far not even coming close to achieving it.

Read more

A few Observations on the XAU Mining Stock Index

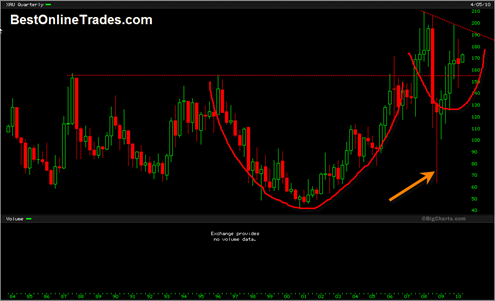
The XAU Gold and Silver Mining stock index has a reputation for being extremely volatile and choppy.  It is a slow moving beast and is also represented by the GDX Market Vectors Gold Miners ETF. Mining stocks and mining stock indices remind me of biotech stocks because they both seem to trade very erratically with … Read more

Going Long the ProShares Ultra Silver ETF Today

Today I went long the ProShares Ultra Silver ETF (AGQ) which is leverage 2x the amount of silver.  If silver moves up 1% then AGQ attempts to move up 2%.  I need to put my money where my mouth is.  In a previous post I talked about how previous metals seem to have a better risk reward than the broad markets right now.

I went long the ProShares Ultra Silver ETF because I want to be early in what I see as a potential big move coming for the precious metals.  Silver has been the ‘slow dog’ in the bull run and to be honest has been severely lagging the move in the gold price so far. 

Having said that, there are two separate takes to explain this. 

One take is that because silver has been lagging the gold price so badly it means that the entire precious metals run is in doubt because silver is not confirming the move in the gold price so far.  This would be known as ‘non confirmation’ similar to the way the Dow Jones Transportation average either confirms or does not confirm the move in the Dow Industrial Average.

The second take is that although silver has been lagging gold, it is just a matter of time before silver plays ‘quick catch up’ to gold and confirms the final blow off move in gold.  This would mean that the price of silver must get an extraordinary rally going in the next year to the 50 dollar range and even beyond that level.  Why? Because the price of gold is already trading at lifetime highs and has already exceeded the old 1980 price high of 850 to 900.  Silver’s high in 1980 was in the 40 to 50 dollar range and so in order for silver to catch up to the gold price it needs to get near those record levels.

This will take some time though assuming I am correct with the ‘second take’.  But it is also important to keep in mind that in many later stages of commodity bull markets 90% of the move can happen in the last 10% of the time.

Read more

Market Bullish Tendencies Keep Rolling on

The market is zooming right into April and the previous monthly MARIBUZU (almost a maribuzu) candlestick is so far evolving into anther maribuzu candlestick for April.  The market is strong. There is no denying it.  The WEEKLY relative strength index is getting close to busting into the 70th percentile powerzone which is a rare but … Read more

Time for a Change in Trading Strategy Towards Gold and Precious Metals

I am a bit frustrated with the stock market indexes right now.  In fact to be honest with you I am sick of them.  There are still opportunities on the long side on plenty of individual stocks (Las Vegas Sands Corp is one of them), but in my opinion it is too late to jump into the long side of any indices, even if they do go to 1200 to 1250 on the SP500.

Where is the risk reward ?

The risk to reward ratio on the indices right now seems like it is close to 2 to 1.  Two ounces of risk for every ounce of reward.

Now as far as the short side of the market and the inverse ETFS such as the Direxion Daily Small Cp Bear 3X Shs (TZA) ETF, it would seem that this inverse ETF still offers some good risk reward to the upside.  But the problem is that today’s close in the indices was still more of the same.  Inching higher like slow water torture 1 point, 1 day at a time for the next 30 days.  That trading dynamic can go on for a long time and to be honest I don’t know when it will stop.

So that means that despite the apparent  good risk reward in the inverse bear ETFS, unless they start performing from the get-go next week, it will be more of the same as their inverse dribble down relationship mirrors the dribble up move of broad market indices.

Read more