Fannie Mae Level 2 and Chart Structure looks Good

Everything is flying up lately including the ever so hated Fannie Mae and Freddie mac.  These two stocks are laggards however they do seem to be catching a good spark and overall the chart structures of both seem supportive of a big breakout within the next two weeks or so.

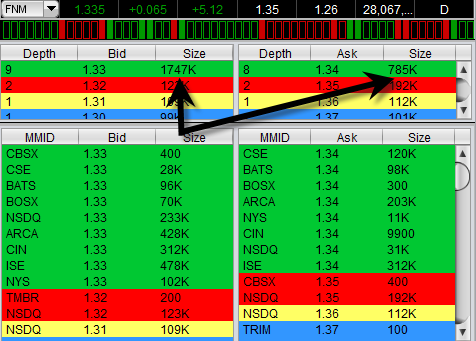
I have been watching level 2 on both of these stocks and I have consistently seen very strong bid support relative to ask volume.  In fact on some occasions the bid support has been stronger than ask volume by a factor of 10 to 1.  So it is telling me that there is some heavy accumulation going on the last several days and ‘they’ appear to want to take both of these higher. 

This should not come as surprise however because most other financials stocks are zooming higher as well such as AIG and BAC and C as well.  Both FNM and FRE are late to the party so to speak but it could be that they are doing a pre earnings run up which I have not been able to confirm as May 6th, 2010.  Yahoo Finance says May 10th, 2010.

fnmlevel2

Level 2 has been useful to me to see the demand and supply situation of a stock.  Usually it is just useful for entries and exits but sometimes you can see a pattern emerge over time as seems to be the case with both FNM and FRE.

Read more

This could be a very important Market Timing Chart and Signal on the QQQQ

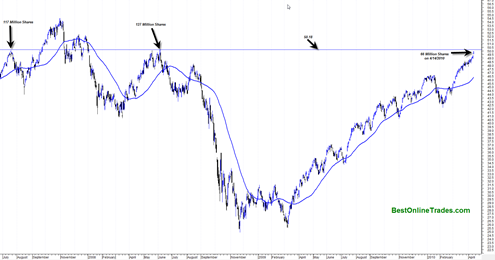
I just loaded up a longer term chart of the QQQQ Nasdaq tracking ETF (PowerShares QQQ Trust, Series 1) and I found a couple of potentially important clues.  The clue has to do with the current level the QQQQ is at right now and where it is situated relative to two other very important peaks.  It also has to do with the volume level at those peaks and the current volume at present day.

Nine times out of ten (my own approximation) whenever you have a stock or index reach a previous key peak level in the market, there is usually some type of retracement for the simple reason that previous holders want to get their money back.  Another reason is because technicians are also watching these levels and use it as an excuse to sell.  And a final reason is the quality of the volume test because in volume analysis you need volume that is within 3% or greater of the previous highs volume for there to be an eventual successful breakout from that level.

The chart of the QQQQ as shown below indicates that it is only .54% away from testing a very key previous resistance level both in terms of price and volume.

qqqq20100414

Basically we are within ‘inches’ of this key level.  The key level on the QQQQ is 50.18.  This is a key level because you can see from the chart the two previous key price peaks were generated at this level and they were relatively sharp peaks.

Read more

Natural Gas May be Bottoming Sooner than Originally Thought

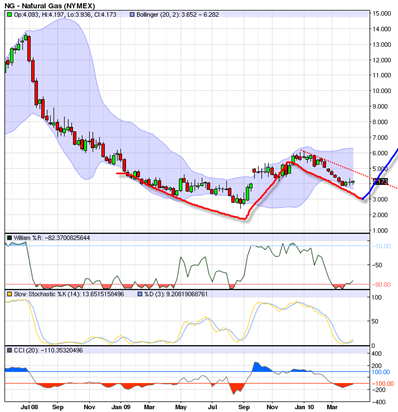
I am still watching the Natural Gas Contract fairly closely.  I thought originally that Natural Gas Futures would trade down near the 3 level as a final bear market low.  But there are a few elements in the current chart that have me at least considering otherwise at this point.

The the weekly chart of Natural Gas is used along with the Bollinger bands it paints a possible picture of a large W bottom forming with the Bollinger bands serving as support.

I recently just read over John Bollinger’s book on Bollinger Bands and he indicates through his book the identification of W bottoms along with the Bollinger Bands as confirmation.

He indicates that one might at first see price move out side of the Bollinger bands to create the first portion of the W bottom, then some type of rally can occur and then a retest of the Bollinger Band that does not break through the second time.  the second retest is also typically right portion of the W pattern before the new uptrend emerges.

Read more

Another Quick look at CAGC China Agritech Inc.

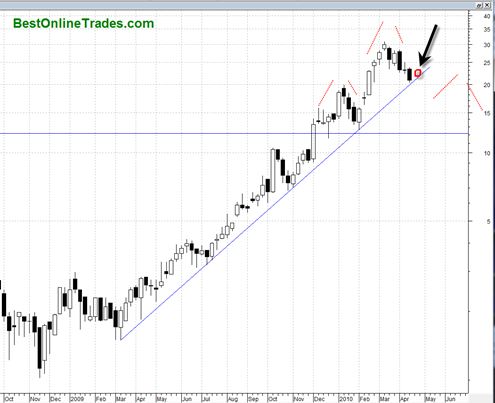
I already talked about China Agritech Inc. yesterday.  But I wanted to post this semi-log chart which more clearly shows the juncture this stock is at right now.  It did break down today and pushed the RSI below historically supportive levels which is a concern.

Also, based on the chart below there is at least the potential for a head and shoulders topping pattern that could be forming.  The pattern can fail as well, but if it is a valid pattern then China Agritech should break down within the next week and a half time span.

If the pattern is not valid then the failure should also be indicated within the next 1 and a half weeks.  The best bullish scenario is for CAGC to hold above 20 by the end of this week and then hold 21 by the end of next week (the red square drawn on the chart below).

If after the end of next week price is still drifting around the 20 range then this entire uptrend is in serious doubt in my opinion.

Read more

Does it Seem Unthinkable to Consider Being Bullish into 2012

The bullishness is simply astounding lately.  It is remarkable.  Undeniable at this point.  It seems like we are up almost every Monday of the week, every Friday of the week and most days in between.

So that must mean we are overbought and ready for an extended nasty decline that will be horrible and scary right ?

Not necessarily.

Yes sentiment is at extremes, technical indicators are at extremes and it really does feel like at least a minor or intermediate pullback is way overdue.  But my take going forward continues to be that the market will keep trying to frustrate the heck out of those who wish to short it.

I tried to short this market several times since October 2009 and most of those attempts failed.  The only one that succeeded was the one in October 2009.  I was lucky to catch that mini decline.  But all the other attempts failed.

Why did they fail? They failed because the primary trend is still very strongly up and in that type of environment every pullback is generally weak and the strong upward trend is eager to reassert itself.

The issue now is what should your general 1 to 2 year trading bias be? Is it even possible to have that long a forecast?  Generally speaking the farther you go out in terms of time, the more difficult it is to get a handle on potential price bias.

Unless…

Unless you have some very large patterns to work with or some other major market clues ( such as foreign indices or commodities ).

Read more

China Agritech Inc at a Moment of Truth

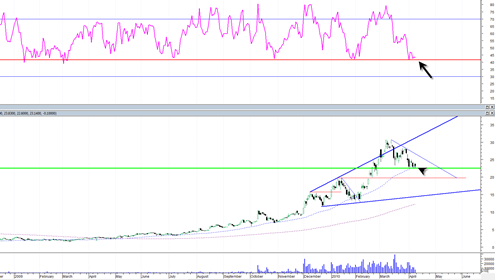
China Agritech Inc. is right now from a technical analysis standpoint at a moment of truth in my opinion.  CAGC in the past has consistently held the support of its 50 day moving average and also the 42 RSI level (Relative Strength Index).

The 42 RSI level has repeatedly served as a base for this stock going all the way back to the start of 2009.  This means that we should expect the 42 RSI level to hold for China Agritech Inc. to keep its longer term bull run intact. 

If the 42 RSI level does not hold then what it says to me is that the longer term ‘easy’ uptrend is broken and CAGC may go into a more complex longer duration correction.

In the short term the stock is suffering from a small descending triangle formation.  These formations can lead to a break down in price but they also have a habit of failing quite often as well.  So if we do get a breakdown out of the small triangle and move below the 42 RSI level then it would seem more corrective action is on its way.

Previously I had drawn a large broadening wedge type pattern on CAGC and if the pattern is accurate then it suggests there is at least the possibility of CAGC going back down to the bottom of the wedge eventually near the 17 level.  That may seem like an unusually large move, but this stock is famous for swinging high but just as easily swinging low when money gets scared.  The float is small and the volatility is high.

Anyway here is the chart I have for CAGC which shows the broadening wedge as well as the critical 42 RSI level indicated by the solid red horizontal line in the indicator portion of the chart.

Read more

Houston American Energy Corporation May Do a Reversal This Week

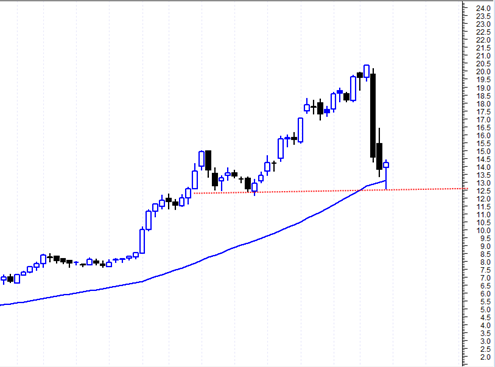
 HUSA Houston American Energy Corporation may get some type of upside reversal going this week based on the reversal hammer I see and the test of recent support area.

This stock came up in a scan from my scanning software.  I was trying to make a formula that finds reversal hammers with long lower candlestick shadows and a hammer body size that is significantly smaller than the entire days range.  Needless to say it was quite a pain at first to work this formula into the software but I think I got it working now and it seems to be churning out some interesting setups such as this one.

I think reversal hammers are a lot more reliable after there has been enough significant choppy price decline before the hammer occurs.  In the case of HUSA, I see that we so far only had 2 big down days that were very fast, so it may make this hammer reversal less reliable and there could actually still be downside continuation this week.

However if HUSA can manage to stay above 13.5 on Monday (4/12/2010), then it could be that some type of reversal could get going into Tuesday to Friday of this week.

Read more

Freddie Mac May Move in Sympathy with AIG soon

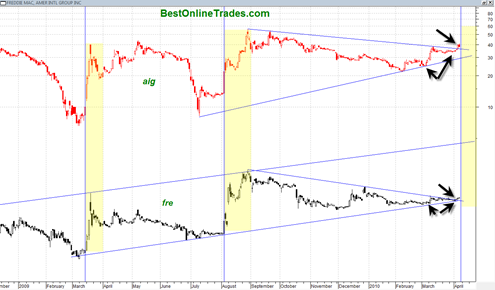
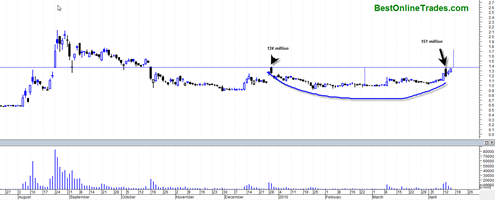
Freddie Mac (FRE) currently price at 1.34 may move higher in sympathy with AIG American International Group, Inc. soon.  FRE continues to be dogged by the housing depression and the government involvement or lack thereof.

However the economy is on the mend and there are some bright spots appear that may lift the shares of Freddie Mac  FRE soon. 

If you put the share prices of AIG and FRE right on top of each other you will see a general tendency towards symmetry on some of the big moves each stock has made over the last year.  There appears to be a slight lag effect in the movement of FRE relative to AIG.

Significantly, AIG has just recently broken out north from a very long term downward sloping resistance line and what also appears to be a very large triangle formation.  Similarly Freddie Mac  FRE has also just done the same thing although it has not really had a breakout type move out of this triangle yet.  To accomplish that it will need to trade and move over the 1.38 level which it may do early next week.

Read more