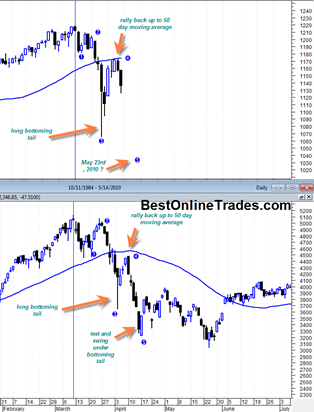
The Art of Tape Reading

It took me a long time to realize that it is often the most subtle signals the market gives you that have the most meaning.  The biggest challenge is figuring out what the market is ‘thinking’ at any moment in time.  Usually this is best done by looking at the indicators in combination with price itself.  I would say that probably more than half of the time, the daily price signals themselves give enough information combined with volume.  But still, that is not enough.  One has to add in a little bit of intuition and gut feel on top of everything else.  And that seems to get better with time and after looking at enough price action on many different charts.

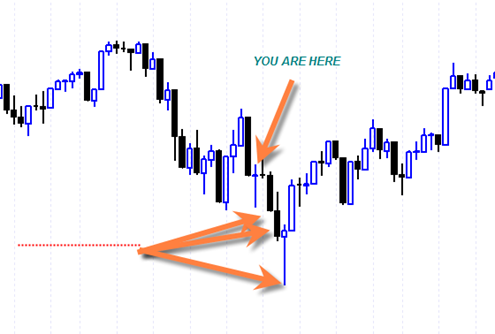
The long legged doji candlestick we printed yesterday on the SP500 was supposed to result in some sort of northward follow through today, but it was not to be seen at all.

During the bull run between March 2009 and April 2010, it seems as though every single reversal doji like that resulted in northward action almost immediately.

Today that was not the case at all.  In fact the market in the early part of the day did get a little bit of a rally going but it was really a weak attempt.  I was looking for 1150 or even a huge squeeze all the way to 1170.  Making it to 1170 would have formed a small double top formation that would have been consistent with the initial 1930’s automatic rally breakdown and then consolidation.

Read more

Nasdaq 2000 Price Collapse versus May 2010 SP500 Price Collapse

After letting the market action ‘soak in’ after the last two days I am coming to the conclusion that we will see two possible scenarios next week.

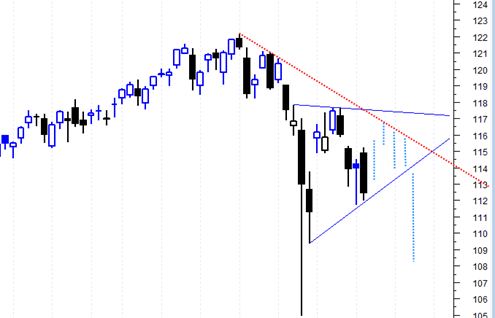
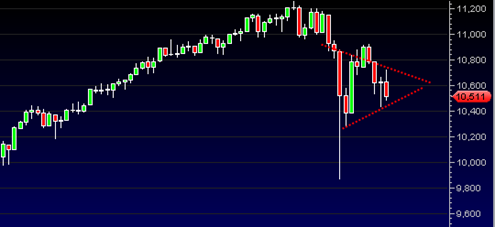
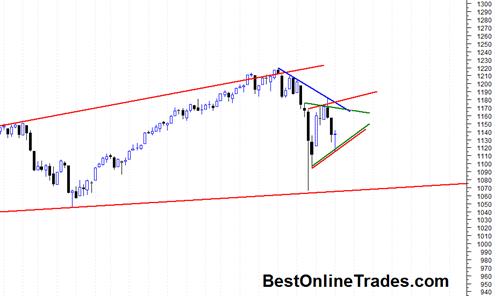
The first one is that we do not head down immediately next week or even mid week and instead tread water slightly higher or even into a new very marginal minor high that exceeds the 5/13/2010 price swing high.  This type of range bound trading action could take the shape of a symmetrical triangle formation that coils up the price action into a spring that breaks either end of this upcoming week or into next week.

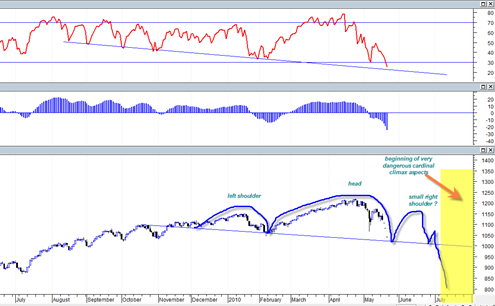
The second scenario is that the market simply falls apart in a series of cascading declines into end of this week, or perhaps into the May 23, 2010 date.  This is currently my favored and gut feel scenario that will play out.  One of the reasons I am favoring this scenario is because of the heavy downside Friday volume.  It was not blow out volume but it was enough for me to sense that it could build into a climax volume with more price destruction.

Also the Euro is in a stance where it could spike lower and gold could spike higher to 1300 to 1400 an ounce in a matter of days.  If you look carefully at the Euro, Gold and the stock market, it paints a picture of some type of climax type move this week or next.

Read more

SP500 Rallies Back up to Neckline of Head and Shoulders Pattern Lower Volume

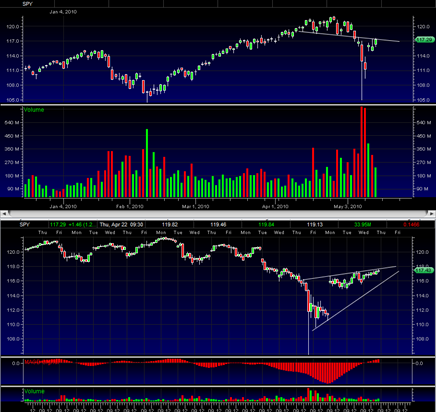
The SP500 today rallied all the way back up to the down sloping neckline of the small head and shoulders topping pattern that formed at the end of April 2010.

Rallies back up to the neckline of confirmed head and shoulders topping patterns is extremely common.  I should also note that this rally back up to the neckline was on significantly weaker volume than the volume that occurred on the downside breakthrough of the neckline.

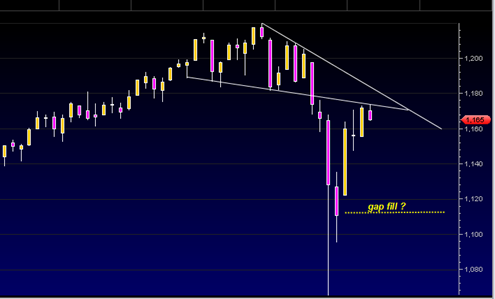
The intraday chart shows that the SPY is trading in the form of a rising wedge on lower volume.  This should mean that we will break down again from here and perhaps attempt to fill the large opening gap that marked the Euro Bailout.

If the SP500 somehow manages to bust higher again tomorrow or Friday as well and get above and stay above 1182 then something is completely wrong with the bear scenario.

Read more