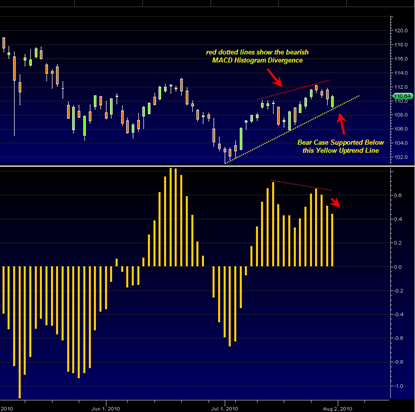
The SPDR S&P 500 ETF today broke down today on 35% greater volume than yesterday although still relatively lower volume as compared to other break downs in recent months.
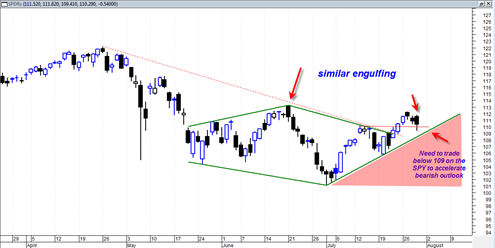
Today the SPY candle engulfed yesterday’s doji candlestick on 35% greater volume. On the Dow Diamonds DIA SPDR Dow Jones Industrial Average ETF today we engulfed yesterday’s near perfect doji on 55% greater volume.
This bearish engulfing setup is somewhat similar to the one that occurred on 6/21/2010 except that today’s engulfing has a slightly more bearish volume characteristic.
Despite these short term signals the fact still remains right now that the SPDR S&P 500 ETF is still trading both above the red dotted down trend line that has defined the bear phase and also above the near term green up trendline since July 1, 2010.
These two facts make it hard to be super bearish right now despite the near term signals of a possible turn down in the market right here. It looks like the GDP report tomorrow is going to swing this market in a decisive direction.
I mentioned in yesterday’s post that the 1100 level on the sp500 was minor support and ideally for the bearish case would close near there or below it by end of this week. That type of close would set up a nice weekly hammer reversal candlestick and give a good shot at next week being hard down. Breaking below the 1100 level enough on the sp500 could help to accelerate selling a bit and also create a 2B sell signal. But again, unless we start trading seriously below the 109 level on the SPDR S&P 500 ETF then I have to conclude that the bulls still have some steam left.


