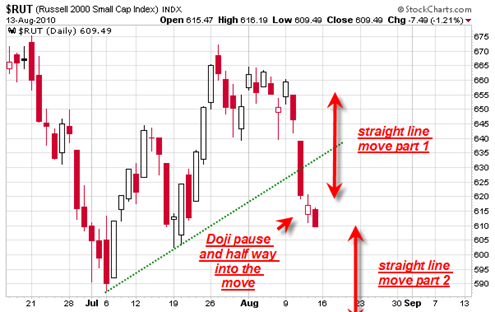
I wrote about the Russell 2000 Index a few days ago and at the time I was writing about it the Russell 2000 looked like it was going to print quite a strong looking reversal hammer by the end of the day. As it turns out the final candlestick was not a reversal hammer at all. It was instead just a somewhat smallish looking doji candlestick.
I am not sure if my data provider was feeding bad data or what the exact problem was, because it was showing me that the Russell 2000 candlestick had a long bottoming tail similar to previous key reversal points in this index.
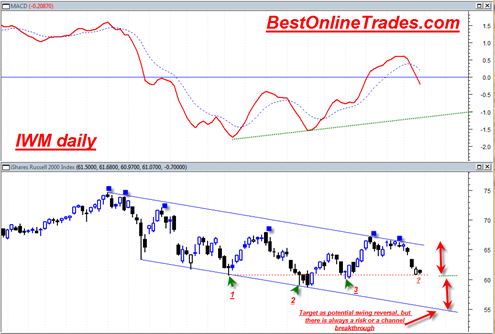
It is a very important difference because the smallish looking doji we printed on this past Thursday 8/12/2010 can now be simply interpreted as a minor pause in the previous down trend and the half way move towards the bottom of an important channel that this index trades in. See the chart below for clarity.
In addition to the recent doji it can clearly be seen that the candlestick the day before was a sign of weakness that broke the uptrend in force since July 1, 2010.
If we look at the chart of the iShares Russell 2000 Index (ETF) (Public, NYSE:IWM) in the slightly larger time frame a more clearly defined picture starts to emerge.
First lets start with a simple truth about the IWM trading pattern since the April 2010 top. It can clearly be seen that the IWM has attempted to rally to a higher high during this entire downward trending trading channel but has each time failed (see the blue solid squares). It has attempted to trade to a higher high 5 separate times but has failed each time. In the two most recent attempts it failed again and made a small double top, and the second top that created the top also was not able to trade to a higher high.


