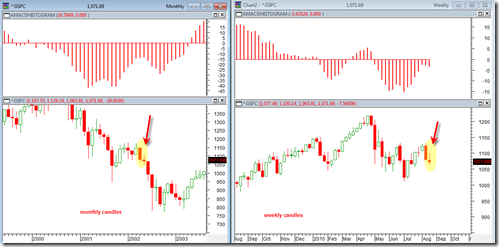
Closed out Shorts Today

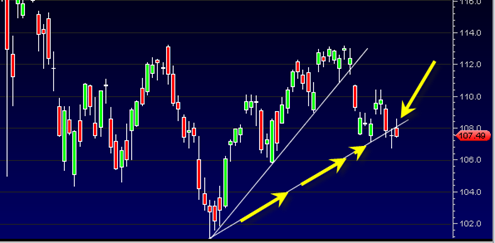
I just closed out the short position I had.  I don’t like the hesitant nature of the market right now and the lack of immediate follow through.  Plus there is a fed gathering the next 2 days and something is going to come out of that meeting that may bounce the market. Another reason I … Read more

sp500 Starting to Trade Along Lower Bollinger Band

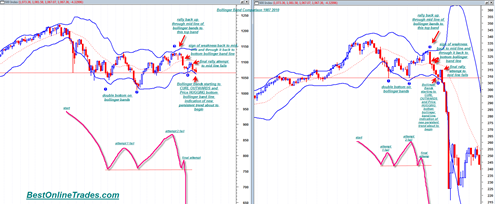
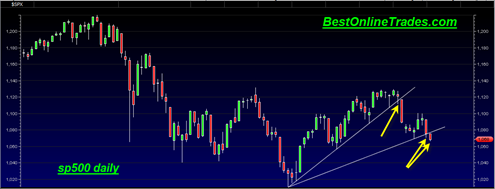
The sp500 today once again briefly pierced the lower Bollinger Band and the Bollinger bands themselves have continued to expand wider.  This is an indication that we are entering early stages of a volatility expansion which is in contrast to the volatility contraction that occurred during the last several months.  The movement higher in the VIX volatility index today is confirming this fact as it broke out today from its large falling wedge formation.

I really have not used Bollinger Bands that much in my analysis but I might start to use them a lot more because they can be a very useful tool for trend direction signals.  They are most useful to me when I see the Bollinger bands move from a state of low volatility (a contraction) to expanding volatility.  The expansion of the bands often signals the start of a new more volatile move.  The piercing of price under either the higher or lower band can be an indication that price now wants to trend or hug closely that particular Bollinger band line.

sp50020100824crash

Sometimes price moves so fast that it can trade almost completely outside one of the lower or upper Bollinger Bands.  This is very rare and is usually a point where the market has climaxed and ready to trade sideways again.

Read more

Bollinger Bands 1987 and 2010

Here is the Bollinger Band comparison chart between the time periods 1987 and 2010.  The time similarity does not exist whatsoever.  I am only trying to identify the overall pattern similarity irrespective of time. The chart below pretty much does the talking.  The market in both time frames does a double bottom on the lower … Read more

My 1987 Stock Market Crash Fantasies Again

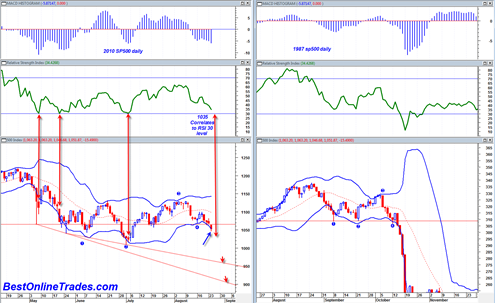
Here we are early in the last week of August 2010 and guess what?  My 1987 crash fantasies are creeping in again.  Perhaps I need to dial a 1-800-crash-aholics anonymous support line if there is one?  When the market gets into a stance that I find somewhat similar to the 1987 crash I start to look at the charts and indicators and see if there is any interpretation that could result in a similar occurrence.  Every single time I have done this in the past has failed so far.  But now I am about to do it again…

I am sure you have already read about the double Hindenburg Omen sell signal which I previously never really followed.  It seems to have a very interesting record which I was reading about over the weekend.  It is interesting to me that this signal is now ‘live’ in the context of the overall price action right now.  It is also interesting to me that the expected occurrence of the crash could start as soon as 1 day or several months.

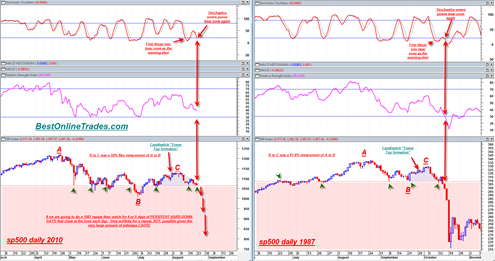
Right now there really does not seem to be any price pattern symmetry between the two periods in terms of time.  The 1987 topping formation formed rather quickly and resolved itself just as fast.  The current topping formation since our April 2010 high has dragged on forever it seems and the price action appears much more complex.

Still, the overall pattern of the 1987 stock market crash was basically an A B C down as well as some other characteristics which I will get into in a minute.  The B to C portion of the 1987 crash was the final upwards retracement rally before the plunge.  In the 1987 period this was a 61.8% fibonacci retracement.

During our 2010 upwards B to C retracement rally we only managed to get to a 50% fibonacci retracment level near the 1030 level (actually it was slightly more than a 50% retracement but not quite 61.8%).

Read more

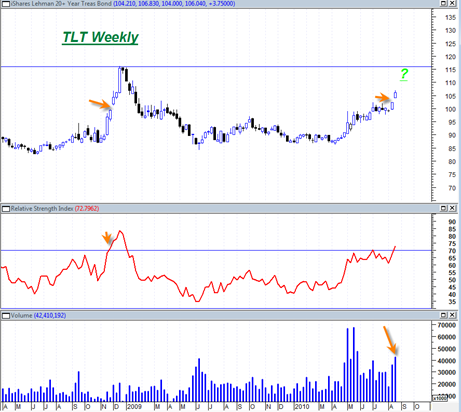
TLT Trading with Unstoppable Confidence

I wanted bring up the TLT chart quickly again just to make a quick point.  I mentioned before about how the TLT ETF moved into the power zone above the 70 level last week and that this could correlate with a very hard down move in the stock market. Anytime any stock or index gets … Read more