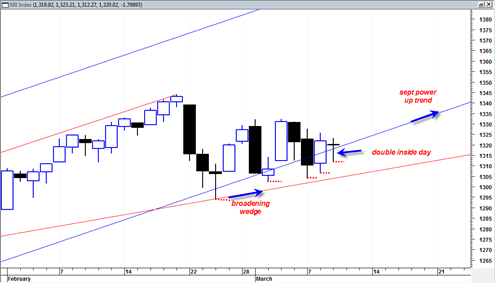
The Broadening wedge formation in the sp500 is still filling out its formation and in general I am viewing this as an eventual bearish resolution type pattern with the outside potential of it turning into a very bearish cascade type decline resolution.
Rising Broadening wedges are a very frustrating type formation because there exists an up trend and yet it is an uptrend defined by an expanding trading range which can be very difficult to identify in the early formation phase.
The weekly MACD and the weekly histogram on the sp500, the nasdaq and the DJIA all see to be confirming the idea that we are topping now and should get a bearish resolution out of this pattern. I have to say that I will be utterly shocked to see a very strong (and quick) bullish resolution out of this pattern the next few weeks. I have been shocked before, but I truly will be this time around if we see a bull resolution out of it.
There are a number of reasons why I think we will get extended bearish resolution soon:
- The weekly MACD is almost at a negative crossover and curl over point. Sometimes the actual crossover can lead to a bullish move, but the potential bearishness of the crossover is undeniable. My chart work is showing that this bearish crossover should occur either by the end of this week or next week. That should mean hard down prices soon.
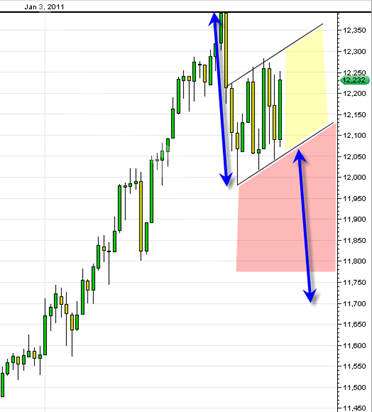
- The DJIA appears to be trading in a violent trading range both up and down lately that defines a rising flag formation that has a clear measured down move.
- I am seeing head and shoulder topping formations on most of the indices.
- I am seeing 3 weekly hanging man candlesticks on the Nasdaq Composite which are still unconfirmed, however to see three of them in a row is a worrying sign.
- The negative heavy volume versus light up volume relationships on the SPY ETF in the recent 3 weeks looks much more bearish than the consolidation that occurred in November 2010. This time around I am seeing much more consistent heavy volume down moves that are more regular and heavy. The up days volume is horrible. This volume pattern suggests to me strongly that we are undergoing distribution currently (big money is moving out of the market). Of course 200 point DJIA up days like we see today are a completely DISTRACTING smoke and mirrors situation that blinds those who don’t also look at the volume relationships.
- If we eliminate all the points I just made above, then just the simple anecdotal point I mentioned in a previous post could be enough reason for us being at a top. The anecdotal point I am referring to is the sub headline on CNBC a week ago that already quickly presumed in question form "on the next leg up will financials lead the way?”.
- NYSE summation index is back in bearish trend mode.
- High flyers such as NFLX on the monthly chart created a huge topping tail on the monthly candle and point to bullish exhaustion for some techs
- AAPL also looks ready to start a bearish trend again.
- The VIX volatility index has a bullish weekly trend and broke out of the long term down trend line.
- The US Dollar so far has not busted below its long term 3 year up trend line and so far on the monthly candlestick is showing a March reversal hammer that could lead to bullish resolution for April. If the inverse correlation with the sp500 is still valid then it supports the case of a big down move in stock market and big up move in the dollar index off of support. Perhaps this would be related to the ending of QE and a tick up in rates to support the dollar?


