Pressure is on the Bulls Next 9 Trading Days

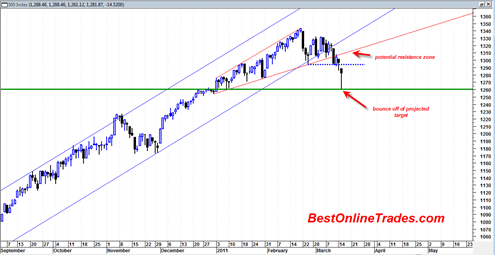
In my opinion all the pressure is on the “Bernanke Bulls” for the next 9 trading days as we go into the end of the first quarter.  They are going to have to pull off their usual and typical ‘miracle runs’ where they manage to evade resistance levels, evade bearish candlesticks, and evade technical oscillators that are going against them now.  Of course it is quite possible for this group to pull it off once again, but I do not believe they will be successful this time around.  Already I am hearing elliott wave arguments about how we have to go to 1400+ first.  I just don’t see it.

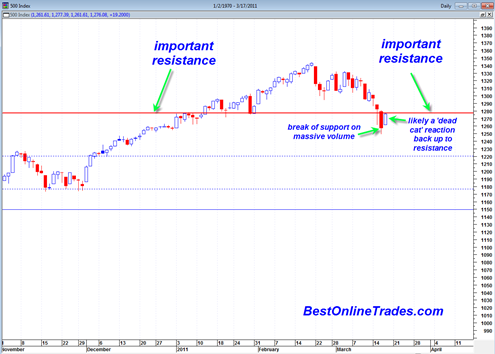
At this point I would say that 1294 is the battle line in the sand that defines who is going to win the next big move in the tape action on the sp500.  1294 represents a key support level that was broken on high volume to the downside.  Now this 1294 level has transformed into resistance and should act like a brick wall for the bulls next week (assuming the bears have the right stuff this time around).

The daily candlestick today on the sp500 was a shooting star hammer reversal candlestick, but still unconfirmed.  These reversal candlesticks on the sp500 have not proven to be very reliable.  So the market could still easily trade higher early next week and evade the short term bearish implications of today’s candlestick.

Read more

sp500 Likely to Find First Stopping Point Either at 1220 or 1180

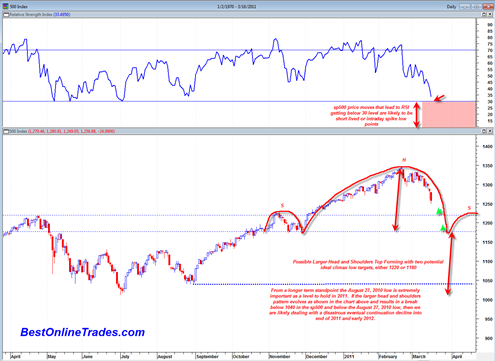
Today the sp500 made it very clear that it was in no mood to get a real bounce going or a reversal of any kind.  Instead the exact opposite occurred.  We made a lower low on dramatically heavier volume.  That says to me that instead of the market moving into some type of short term high on 3/18/11 or 3/21/11 it looks more likely that it will make some type of spike low into these dates.  This could end up being the first tradeable bottom of the current decline.

It just feels like the current decline has not reached an exhaustion point yet.  This decline is still too orderly and structured.  In addition I do not see any clear or obvious candlestick reversal patterns today to work from.  Had we closed today near the opening price then it would have at least opened the door to a big hammer reversal candlestick.  But this was not the case.

Everything I am looking at seems to suggest that we should push towards some type of climax bottom, perhaps during the next 2 to 3 trading days.  It really does not make much sense that a bottom would be formed on a Thursday or a Friday given everything that is going on right now in the world, so Monday 3/21/11 seems like the obvious choice.   But then what would the market do on a Thursday?  Perhaps Thursday we get some type of meager bounce which then eventually leads to a roll over on Friday and then capitulation on Monday.

Read more

Market Moving into Crash Mode

The market appears to be moving into crash mode or into a panic type intra day low that may occur either this Friday 3/18 or the Monday after the weekend 3/21. This could be a huge one day move and may even take the SPY to a gap fill near the 120 range.  The volume … Read more

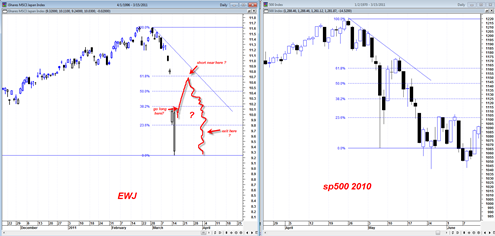
Nikkei Crash Today Similar to May 6, 2010 sp500 Crash

There was a huge huge trade that I missed today unfortunately and also was not quick enough to write about it.  The trade was going long the EWJ (Japanese Nikkei ETF) right near the open today.

The EWJ opened down in crash fashion because of the overnight drop in Nikkei Futures.  The opening in the EWJ ETF was so extreme that it had the daily RSI at a record record low point perhaps near a value of 10 RSI, not only that but the EWJ also opened right at a strong level of support from the June July 2010 time frame.  This morning was a huge opportunity to go either long the EWJ or long some March or April call options on the EWJ for potential 100% to 500% profits by the end of day.

Certainly based on the news it would have appeared that the EWJ was an extremely high risk trade with the nuclear and earthquake fears, but in actuality this is one of the lowest risk trades one can take in my opinion.

You had washout blow out panic volume, massive oversold RSI and opening right near an important support range.

I think it is quite fair to describe the recent 5 day move in the Japanese Nikkei index a crash in terms of the speed and magnitude of the decline.

So the lowest risk trade was near the open today, but there may still be a chance to trade the EWJ as it is now still in a very high volatility cycle and we should see huge swings in both directions.  But I would say that now the trade becomes much more dangerous compared to this morning’s trade.

Read more

sp500 Goes Into Panic Decline Today on Heavy Volume

It looks like there is a strong probability we have created the first tradeable low in the sp500 today on this panic of the Japan earthquake and nuclear situation.  I wrote in a previous post that the sp500 was forming an important broadening wedge formation and that the ideal target for the drop is the 1260 to 1270 range which would be the beginning formation of the broadening wedge.  As it turns out this is almost exactly what happened.

Today had the flavor of a panic high emotion low with very heavy volume. 

The ARMS index today hit an intra day high of close to 12 which is an astounding amount of intra day fear and helps argue the case that we are near an important trading low.  I believe that is only the second time in history that the ARMS hit such a high level.

My understanding of the rising broadening wedge formation is that it does not necessarily have to be a major top, it can simply also be a corrective formation within an uptrend.  This is important because I still think it good to keep an open mind about the nature of the current correction.

Read more

Any Bounce Going Forward in sp500 Near Term Should be Shorted

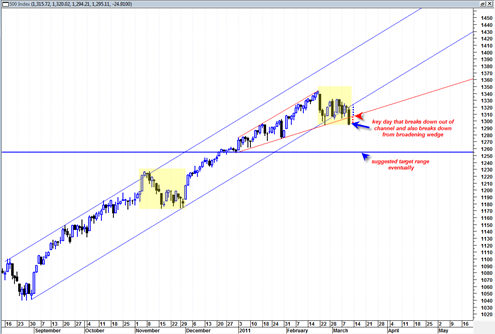
Today was a clear confirmation to me that we have switched from the massive bullish trend since late August 2010 to a beginning bearish trend.  In yesterday’s post I pointed out the double inside day 3 day price pattern in the sp500 and said it would lead to a huge move either up or down. Today it was clearly down, closed at the lows and also had more than enough volume to go with it.

I think we could get some type of upward bounce tomorrow on some positive consumer confidence numbers but then maybe a sell off near the close.

A bounce higher tomorrow could reach two possible levels.  One level corresponds with the underside of the broadening wedge formation I have been talking about now for quite some time.  The other level corresponds to the underside of the up channel we just broke down through.

My preferred choice is that we bounce to the underside of the broadening wedge and then get stuck there for a while and then fail at the end of day.

The much more painful upside bounce level would be back to the underside of the channel we just broke down through.  The reason why it would be more painful is because it would completely erase all of today’s short selling gains.

sp50020110310

So again the preferred scenario is for an upward retracement to the point indicated by the red arrow in the chart of the sp500 above. I would look for any rally to run into a brick wall near those levels and gauge the market carefully from there.

Read more