Gold Price ETF does a Teaser Life Time High Today

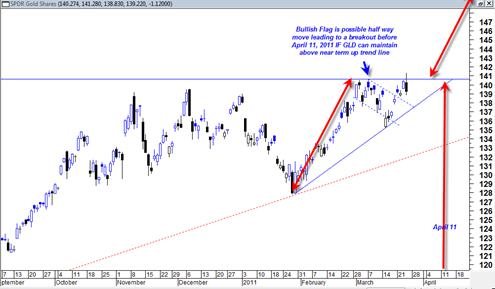
Today the gold price ETF and the spot gold price rallied up to life time highs but then sold off end of day to settle and close under yesterday’s low.  I have seen this type of action before on the gold price as it attempts to break out to new all time highs.

At this point I do not believe the head fake.  I think ‘they’ are trying to create the illusion that this was a reversal sell off and important rejection of the highs to be followed by another leg down.  I think if they had closed the GLD ETF down much more, perhaps 2% or more it would have made a much more dramatic statement.

Instead, we see that the GLD pushed to new life time highs and tested two important price swings in early March on equal or greater volume, a positive sign.

After hours the GLD bumped up quite a bit, moderating the potential short term bearish looking candlestick.  But again, it is only moderately bearish to me.  I think today is a head fake to sooth the gold top calling crowd.

One mental trick to use when viewing intra day price reversals like we see in the GLD today is to see how negative a close occurs relative to the previous day’s candlestick.   In some cases one can see a strong intra day reversal and yet the close did not even manage to get under the previous day’s high.  In my experience those reversals are usually just consolidations rather than all out bearish trend changes.

Read more

Stock Market is Likely to Trade Decisively Off of Friday’s GDP Number

The way the market is trading right now suggest to me that it is going to make a decision off of the GDP number this Friday.  Odds seem to suggest that the number will either be in line or good which would seem to support a break out type move.

In recent days I have been focusing on the IWM Russell 2000 ETF as a possible leading indicator.  The Silver ETF has been perhaps the ultimate leading indicator (new 52 week highs today) with the Gold ETF being the second best leading indicator (Right at previous 52 week highs, but not new 52 week highs yet).  Then I would say the IWM falls in third place.

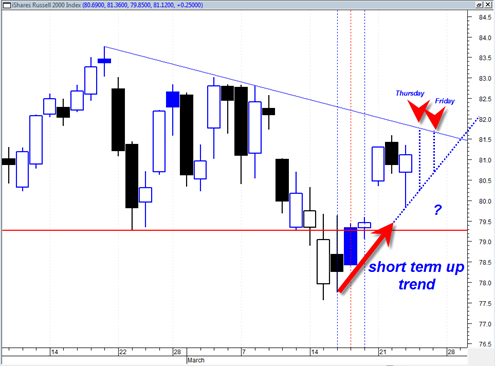
I do not want to ‘pre judge’ the IWM ETF too much at this point.  My bias now is that it is headed for an upside breakout from the current congestion range, but depending on how the end of week shapes up, it could still be at risk of a move back down into the neutral zone.

Making any commitment now would be a mistake because the market has not made any clear decision yet.  It still has to work out a few small battles in the near term.

iwm20110323

A break down through the short term up trend line is the first indication that something is wrong with the potential northward breakout.

Read more

Silver ETF SLV Continues to Blast Higher to New 52 Week Highs

Hi Ho Silver!  Silver is a leading indicator for gold and the stock market apparently right now.  It has blasted today to new 52 week highs and the RSI is currently right under the powerzone level of 70.  A blast above RSI 70 will send SLV into the powerzone and we could see some more big moves to the upside.

Gold was also strong today, but silver is leading the pack.  I suspect that both gold and the broad market will head higher again soon and silver wants to lead the way. What a great leading indicator.

Volume today on the SLV ETF nearly doubled what it was yesterday, a positive sign.  When I say that the SLV could see some extended big moves I am speculating this to be the case for the simple reason that silver is in a strong parabolic portion of its move where momentum is at an extreme.

Of course this is nice as long as the SLV keeps going up, but nothing grows to the sky forever.  Eventually there will be a violent pull back, especially in the more volatile silver sector.

It is a good idea to draw tight up trend lines and then just stay long as long as the up trend is not violated.  If it is, then it is the perfect excuse to stand aside until a clearer picture develops.

slv20110323

Read more

SKY MOBI a Potential Huge China Growth Stock

I really like the potential of MOBI, a Chinese Growth Stock and an IPO as of 12/10/10.  I found out about MOBI through MarketClub’s Powerful Chart Analysis and Smart Scan Tool.  Some Chinese stocks have taken big beatings in late 2010 and early 2011 as there have been some issues with their accounting and business practices (ie. CAGR).  However I do not think this is a reason to paint all Chinese stocks with the same brush stroke.

MOBI is in the mobile applications space which is currently a very high growth area.  The mobile internet applications market is a great growth sector and probably even more so in China.

The Sky Mobi investor section of their website describes their business as:

Sky-mobi Limited (Nasdaq:MOBI), operates the leading mobile application store in China. We work with handset companies to pre-install our Maopao mobile application store on handsets and with content developers to provide users with high quality applications and content titles. From January 1, 2007 to September 30, 2010, Maopao had approximately 479 million cumulative users. Over the same period, we offered over 770 applications and over 61,000 content titles and the cumulative number of downloads reached 3.6 billion.

MOBI has a very small float in the 7 million share range.  This means that this stock can move very fast and since it is an IPO there is no previous resistance in terms of the price trend.

I really think MOBI has a good shot at getting to 20 dollars close to double the current price range.  This stock has the growth, the market and the sector that are very favorable.

Read more

It is all up to the IWM Russell 2000 ETF

The Russell 2000 during the recent ‘earthquake’ correction has held up surprisingly well.  During the midst of the correction I had eyed the Russell 2000 several times and it bothered me from a bearish perspective that it was not breaking down from support.  The decline was too weak.

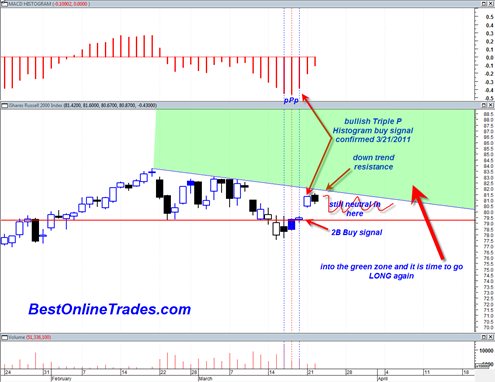
So sure enough now we see the IWM Russell 2000 small cap ETF blasting back inside the range having created a 2B Buy Signal and a confirmed daily MACD histogram buy signal. 

Like an animal trying to find its way out of a cage, the IWM is now once again near the top range of the recent pattern and it must make a decision whether to initiated a northward breakout or fall back within the neutral range and then decide later what to do.

I have seen this type of chart setup many times in the past and it looks to me like a northward breakout will come soon, perhaps by this Friday 3/25/2011.  The IWM 2 month pattern looks once again like the typical sideways type corrections that we have been seeing frequently in recent years.  These sideways corrections, that show an inability to get real % damage to the downside are the most bullish type of corrections.

Read more

Silver Futures Trading with Monster Momentum

The relative strength of silver futures relative to gold is quite amazing to watch in recent months.  The current tape action of silver futures and the silver ETF is almost better than textbook type price action.  Up days are much more frequent than down days, and when an occasional down day does occur it is often in the form of a constructive candlestick formation.  The up day price bars how a persistent replenishing demand for silver and show that strong hands are in control.

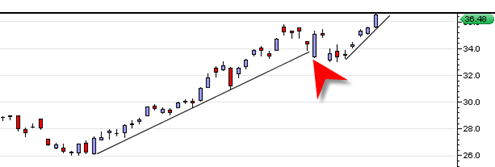
From March 7 to March 15, 2011, silver futures took a bit of a hit which was in tandem with the sp500 ‘Japan earthquake’ correction.  But now during the recent 3 trading days we see that silver futures have bounced right back up to near the 52 week high range almost instantly like a powerful spring.  Silver has basically said if it had a voice, “I don’t feel like correcting now and will strongly reject the 33.5 range and try the other side”.  The other side in this case is 36.50.

Both Silver and Gold have been great early indicators or sensitivity indicators to look towards when trying to gauge the potential for how serious a broad market correction will be.  If you see gold and silver very reluctant to give back ground during an sp500 correction, then it could imply the stock market correction will be limited.  This appears to be the case right now.

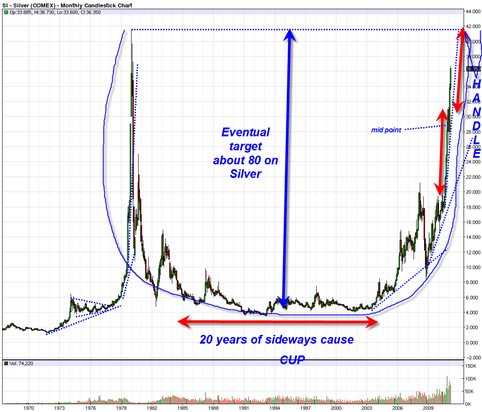
It looks like the other side is going to be busted in short order to the upside which could even further accelerate a parabolic move for silver towards the 45 to 50 range.  This could be a very fast move if silver is able to successfully break above 36 with conviction.  If we look at the move that started in late January 2011 and then measure up to the recent minor correction, it could imply that the recent correction is serving as a pausing point and half way move point for a follow on move of about 9 dollars which would target the 45 range as a target.  If correct, then this 45 range target could come quite quickly.  As I alluded to several times before, the metals are moving into parabolic mode which means faster moves with possible multiple unfilled continuation gaps to the upside.

Read more

Bearish Case for the sp500 almost destroyed today

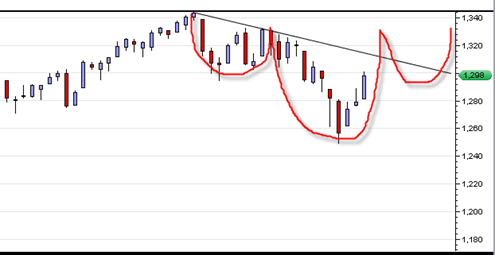
The bearish case I have been ranting about in the sp500 may be dead as of today.  Especially if we close near the highs.  If we close above 1300 it could mean a swift move up to 1330 and only THEN some type of retracement which would lead to a right shoulder forming of a head and shoulder bottom formation.

This market has been characteristic of blowing the bears away and in true form seems to want to do it again.  Whether or not it can accomplish this by the close remains to be seen.

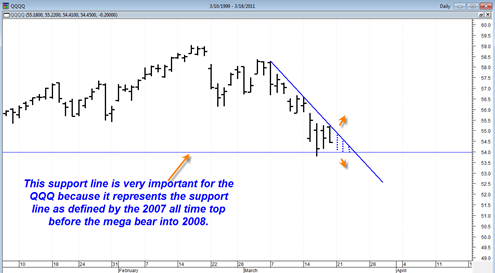
The way that the Nasdaq 100 has been retesting its 2007 highs was definitely a concern for the bearish case.  Why?  Because it could simply have meant that the decline is over up to this point and a simply retest of the 2007 was at hand.  Today we see a strong reaction up off of this retest and it really does cause issue/concern with the more bearish case.

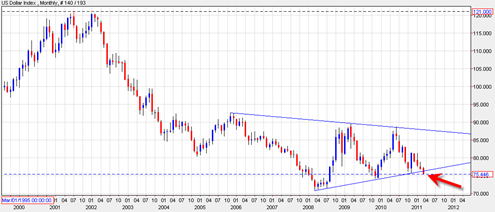
There is also something else going on now, namely the US Dollar index.  It has broken down badly out of a 5 year symmetrical triangle formation.  This means that equity and commodity prices are likely to be supported.  This is basically the same pattern that has been happening for a long long time now.  It will probably mean that the DJIA will be able to get to very large numbers while the real buying power of that number is maybe cut in half.

Read more

Game Set and Match all Riding on the QQQQ and AAPL Inc

Apple Inc. makes up quite a large percentage of the QQQQ ETF  and makes it hard for the QQQQ or Nasdaq to outperform if AAPL is trading extra weak on any given day.  This is what appeared to be happening last Friday 3/18/2011.   Apple was trading weak for a good portion of the day and it did not allow the Nasdaq or QQQ ETF to get as much bounce as several other popular indices.

Apple Inc. without a doubt has been the ‘lead sled dog’ in the huge market run up since 3/ 2009.  It has been the ultimate momentum stock and trading machine.  A lot of traders have expressed the thought that there really cannot be any market top or major correction unless the big Apple falls from grace.  This has proven to be very true since 3/ 2009.

Apple seems to have been the ‘bubble stock’ that everyone looked towards for leadership.  The literal obsession with iphones and ipads reminds me of the internet euphoria of the 2000 era.

But now there seem to be some headwinds for Apple Inc.   Inflation is starting to surge.  Crude oil is spiking higher.  Competition is heavy and increasing.  And Steve Jobs does not appear to be ready to return to run the company any time soon.  Could it be that AAPL is at an juncture where growth is going to start to slow down slightly?  If this holds true then it would seem reasonable for the stock to take some what of a breather and head into a trading range again.

Read more