The BestOnlineTrades Cheetah Trading System

I decided to change the name of this ‘project’ I am working from BestOnlineTrades Mastermind Project, to the ‘Cheetah Trading System’.  I think the later is a more appropriate title.  A mastermind project implies a coordinated effort of the mastermind, in this case a group either small or large of many traders. I suppose such … Read more

BestOnlineTrades Cheetah Trading System Trade 1 Review

This posting is a review of trade number one of the BestOnlineTrades Cheetah Trading System.  The first trade of the BOT Cheetah Trading System was not the way I wanted to kickstart this project.  It started with a loss of 1.71% and it was an absolutely silly loss and I can already see that I broke two important trading rules on the first trade of the project!!

I don’t know if this is a bad omen or not, but I will shrug it off in the hopes that this first posting offers something to be learned for FUTURE trades of the project.

By the way, I am also making it a requirement that before I initiate the next trade of the project, that I MUST read the postings of the previous trades to see if there were any important lessons that can be used to improve the next trade.

The first trade going long VG I made two very important mistakes which I hope will never be repeated again.

Mistake 1

First, I went long VG after it was already moving upwards for 6 straight days !!!!  This is a statistical probability that goes against anyone wanting to go long.  Going long any stock after a strong of advances like that is always a mistake, ALWAYS.

Instead I should have WAITED for the stock to retrace.

Mistake 2

This brings me to the second mistake I made with VG (Vonage Holdings Inc.).

The stock was fast approaching two very high volume swing highs.  In that situation there is almost always a pull back and is another reason to WAIT before going long the stock.

Read more

Sp500 Pushing on a Weak String to the Downside

The bears seem to have little or no power based on today’s price action in the sp500.  The downside volume in the SPY was horrible (meaning very light) and tells me this market is weak to the downside.  And that means of course that the right side must be the upside.  And so it shall be.

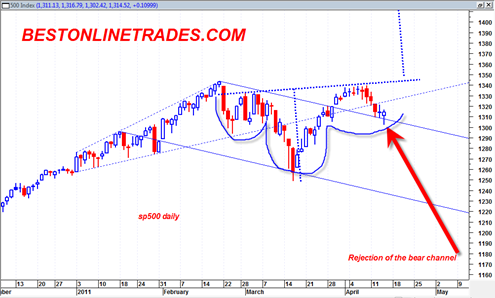
The current decline is probably now the ‘handle’ of a cup and handle formation, which means we are likely to bust north either by end of April or early May 2011.  The saying “Sell in May in Go Away” does not look like it will work this year.  Instead it will be more like “Sell in April (a very little amount) and then Come Back in May for more Drunken Hyper inflated Upside courtesy of the Fed”

The sp500 today rejected the bearish channel I was talking about in the last few postings.  We have a hammer reversal and it is likely to be confirmed to the upside tomorrow or early next week.

sp50020110414

You can also see in the chart above the apparent development of an inverse head and shoulders pattern that has the right portion looking like a cup and handle formation.

Read more

Sp500 on the Brink of Holding Channel Support or Busting Back Inside

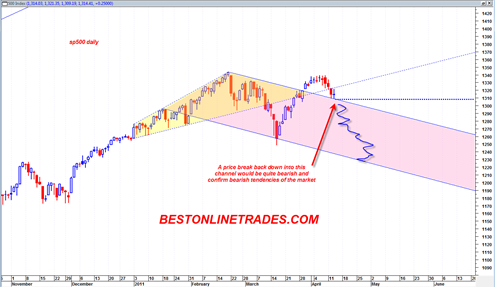
If the sp500 trades a full price bar below 1309 tomorrow with 1309 as the high then it will be trading back inside the bearish trend channel and make the recent last 2 to 3 weeks a ‘false breakout’ above the channel.  This would be quite a bearish situation and further confirm the bearish trend.  Today the price formed a doji or pausing candlestick that seems to have tested the underside of the broadening wedge line.

A gap down opening tomorrow starting at 1309 would certainly do the trick to clue in that we are about to break back inside this channel.

Still, there is still an opportunity for the market to trade bullish in the current range.  If the sp500 trades sideways or up, with today’s low of 1309 as the final low then a bullish picture could emerge from here.  An added reason for a potential bullish move out of here is the lack of heavy downside volume.

We do not have to break back down into the bearish channel tomorrow, but it would certainly help the current bearish possibilities of the market.

sp50020110413

Read more

Here is a Possible Crash Scenario for the sp500

Here at BestOnlineTrades we like to consider a realm of possibilities for the market at any one time.  Sometimes they are bullish, sometimes they are bearish, and sometimes there exists a very remote possibility of a stock market crash.

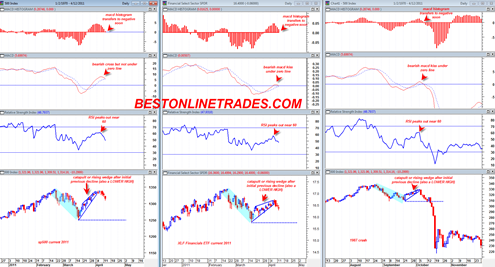
So, after reviewing a few charts of the sp500 in the current time frame and the 1987 time frame and then also the XLF financials ETF, we see that there is a possible window for a crash to develop. 

These types of setups can occur a few times every few years and 99% of the time they fail and do not lead to the massive volatility of a stock market crash.  Still, I like to display and consider possibilities, but am well aware that bearish expectation must be kept under control and ‘tempered’ significantly depending on price action developments.

In some cases a posting like this can be a strong contrary signal!  (in other words meaning that we may have hit bottom).

However at this time I do not see much expectation for a big drop in the market.  In fact when we get a reactionary rally back up to the old 52 week highs, it tends to really discourage the bears and short sellers and squeezes them out, sometimes leading to a new decline that becomes very persistent because of their lack of participation and short covering.

Read more

The Most Bearish Monthly Hanging Man Candlestick in 41 Years on sp500

Sometimes you have to stare at your price charts a little bit longer to understand the real potential magnitude of what you are dealing with.  Sometimes hidden clues in the charts only make themselves known until extensive contemplation and study.

BestOnlineTrades continues to push the limits of proper interpretation of these markets and we continue to focus on interpreting price action across multiple time frames.  Only those who are able to interpret the price action properly across multiple time frames stand the best chance at understanding future market direction.

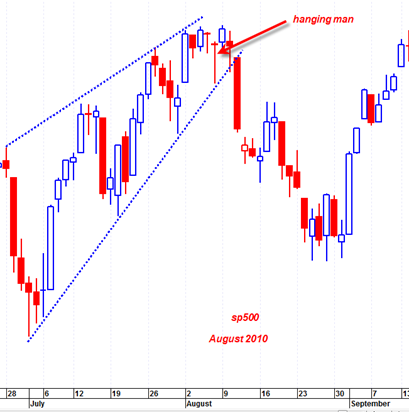
I was recently reviewing the monthly candlestick chart on the sp500 and it seems pretty clear to me now that the March 2011 monthly price candlestick is ‘potentially’ the most bearish monthly hanging man candlestick we have seen since in 41 years on the sp500.  My chart data on the sp500 only goes back 41 years, so there could be a monthly hanging man that looks just as bearish as the March 2011 candle, but at least going back to 1970 I have not seen any with as much bearish potential as this one.  In other words I have not seen in 41 years a monthly hanging man with such a LONG bottoming tail and a clean body with almost no top candle wick on it.

This monthly March 2011 hanging man candlestick is potentially very bearish because it has all of the perfect elements that make for a potent hanging man candle.

Read more

Bearish Weekly Trend on sp500 May Start to Gain Momentum Again

I think evidence is starting to pile up that the weekly sell signal given in early March 2011 is now starting to re establish itself.  There is a confirmed weekly MACD sell signal based on the MACD weekly histogram today, but we are only two days into the week.  This signal can still reverse itself during the next 3 trading days.  If it does not then of course the weekly confirmed sell will remain intact.

The downside volume in the SPY was actually quite average today and I am not quite sure whether to interpret this as complacency or a sign of a weak bearish attempt.

The advance since the 3/16/2011 high volume swing low appears to be a rising wedge formation that has pressed back up to the old highs.  Up at the old highs we recently saw several doji candlesticks which marked an indecision point.  Now the market has turned down again, although not to an extreme. 

sp50020110412

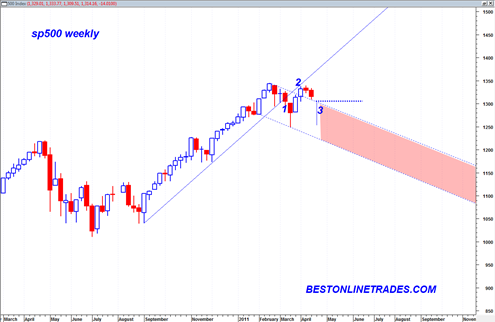
Looking at the weekly chart we can see that the weekly up trend was broken with high volume at (1).  Then we had the two to three week upwards rally back under the up trend line to (2) forming several daily doji candlesticks.  But now so far this week we are retracing down a bit and today we touched the top of this large declining channel.

Read more