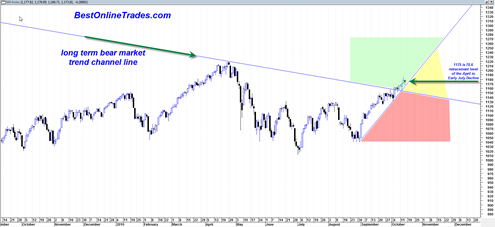
Despite me issuing a BOT Short Signal today I have to confess that by the close today there was no major sign of weakness in the sp500. On the contrary the market rallied to an almost unchanged close right in the last few minutes. If the sp500 closes above yesterday’s high of 1184.38 tomorrow then I will have to switch to a BOT Neutral Signal and then just wait out the markets next moves sometime next week. If we close below today’s low tomorrow it may start to confirm further weakness next week.
I took a look at the BKX banking index versus the sp500 going back to March 2009 and it seems pretty typical for the BKX during that time to be the slow laggard just choppy trading playing ‘catch up’ to the sp500 during this time frame. They moved similar, but the BKX was the laggard.
It is possible that this pattern is repeating now and it may be that I am placing too much importance on the BKX weakness today in terms of how it may affect the broad market advance. Still, the chart I posted earlier of the BKX is something to keep an eye on because if it continues lower and shows more weakness and breaks below key support of 45.40 range, then it might become more of a problem than seems apparent now.
The US Dollar Index is inching closer and closer to uptrendline support from its large triangle. It is within inches of this support and one would expect at least some type of northward reaction during the last couple weeks of October.
The sp500 is currently showing a bearish triple M possible sell signal which would only be confirmed with a close below today’s low tomorrow. We also printed a potential ‘hanging man’ candlestick pattern which is not confirmed, but would be with a close below today’s low. But a close below today’s low on 10/15/2010 would not really leave the sp500 much wiggle room in terms of being able to maintain its steep uptrend line.
Indeed, a strong down close tomorrow would put the sp500 in this yellow shaded caution zone I have drawn in that represents a break of the current step uptrend but still on top of the 2007 bear market channel resistance line.
A break into the yellow shaded resistance zone AND then eventually a break down into the red shaded zone under the bear market channel line would be very bad news for the market in terms of the technical outlook in my opinion. Why? Because it would indicate that the recent 7 days move above the 2007 resistance line was a false breakout. Now whether or not the BKX recent false breakout will cause the sp500 to do the same in the days and week ahead remains to be seen.
I have been quite bullish as of late due in large part to my observation of the move north of the 2007 3 year bear market channel line. But there are some ‘strings attached’ to this accomplishment. The condition I present to the market is that it must continue to prove it has staying power after the breakout. There is a window of time during which the market must prove this. If it is unable to prove its staying power then my respect for the breakout is going to decline very rapidly.
I also checked the average volume again on this up leg that began in early September so far. It still comes in at about 190 million shares on the SPY ETF. This is still weaker than the previous two major up legs in the market during last 6 months of 239 million and 207 million. The average volume is not a very precise sell signal by any means but it may be a clue about the health and sustainability of this current uptrend.
Lastly, if you look at the chart above you can see the green arrow that references the 1175 level on the sp500. The 1175 level is important because it represents the exact 78.6 Fibonacci retracement level of the decline in the market between April 2010 and the low in very early July 2010. The 78.6 Fibonacci retracement level is often considered the last ‘battle line’ that must be defended by the bears to keep the down trend intact. A break down from here would tend to confirm this resistance level whereas a break up from here would tend to invalidate it.


thank you for your post and work
Personal observation. I think this is the kind of market that fakes out a lot of bears. They mistake a pause that refreshes with a sign that the bulls are exhausted.
This is a very dangerous market to short.
The bears may be right but they have lost a lot of money trying to pick the top!
JR I tend to agree with you.. Top picking is a very dangerous business. But sometimes there are enough clues and warnings that say a trend change is at hand.. The trend is still up, but the market needs to keep behaving for us to keep us convinced trend is up 🙂