But the problem is I am just a tiny water droplet and the market itself is an entire ocean. The market could care less what I think and it will do exactly what it wants to do on its own time.
I have done a number of posts on what appear to be good reasons for a near term bearish resolution in price behavior for the sp500 and most other major broad market indices. But despite that recent bias, I have to pinch myself and at least consider a bullish possibility for the market going into the long Easter holiday weekend.
By many measures the market is overbought. But a market just being overbought is sometimes not enough of a reason for it to decline. It can continue into ‘tilt mode’ overbought before any meaningful price reversal occurs.
The jobs report is coming out this Friday. There will be no trading that day. So whatever the results are of that report will have 3 full days to build up and stew over the long weekend. That 3 day rest period before a market reaction usually leads to a very big opening move to start the following week. And the market as of late has a very strong habit of being up on Mondays.
But everything seems to be relying on the interpretation of Friday’s jobs report. Most of the news lately has been good news and it just seems to keep on coming, so why should this Friday be any different ?
I can speculate until I am blue in the face and will still not be able to figure out how the market will react on Monday of next week.
So here are the cold hard facts based on the chart:
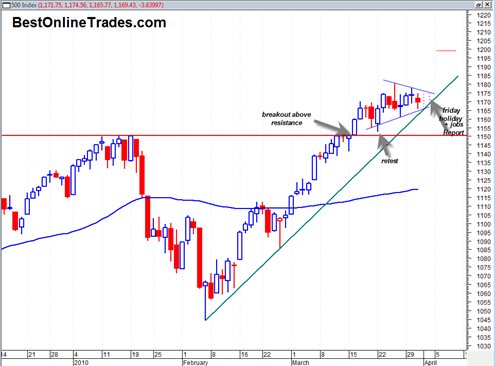
The SP500 since early February has been in a very strong uptrend. In early March it broke out above a significant resistance line with a moderate sign of strength and then attempted to retest the breakout area a few days later.
Thereafter the SP500 has traded in a sideways structure resembling that of a symmetrical triangle. That triangle could also be interpreted as a small rising wedge depending on which price bars make up the trendlines. But for the purposes of this post I am drawing it as a symmetrical triangle.
The triangle is drilling sideways and moving towards the solid green uptrendline which has defined this ‘super uptrend’.
The two pink dashed lines represent 4/1/2010 trading day and 4/2/2010 on which day there is no trading. So the second dashed pink line actually represents Monday’s next week trading day.
So what is my point?
My point is that at least up to this point the market has elected to trade in a sideways price triangle and position itself right at the supporting green uptrendline. Until that trendline is broken, we must assume that the trend is still up. It is very clear that Monday’s price action has very little wiggle room. It either has to go up in a big way and confirm the supportive nature of this rising green trendline, OR it has to break down and through the green trendline and show that the uptrend is in doubt and correction likely to ensue. (By the way, the Russell 2000 Index chart is also still supported by a rising trendline similar to the one I have drawn in for the sp500 above).
I wish I had the answer as to which way this will break out. I don’t.
But I will say that based on this new interpretation that I entered the Direxion Daily Small Cp Bear 3X Shs (TZA) too early. The better entry (or lack of entry) would have been right near the open on Monday based on the structure of the above chart.
If the news is extremely bullish then the market (sp500) will likely gap up and go right from the start. In that case TZA would clearly not be in favor and maybe gap down 3 to 5%?
If the news is extremely bearish, well then the TZA will likely gap up 3 to 5% on the open Monday and it would be a more ideal entry because one would have the benefit of the market already interpreting the news and ready to choose a direction with conviction (confirmation).
So holding the TZA over the long weekend leaves open the possibility of having to take an immediate loss of 3 to 5% come Monday morning. Not good.
So the better risk managed trade is the one that occurs on Monday in the AM ( unless of course you are trading futures on Sunday night ) according to this chart setup.
One last thing, that small triangle in the chart above has rough measurement implications of 1200 on the sp500 if it is resolved bullishly (oddly enough that level is near the average sp500 target level set by many big investment banks for 2010).


