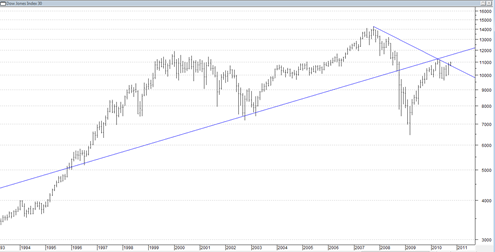
Here is a quick chart zoomed in a little bit of the 70 year channel line in the DJIA and the 3 year 2007 channel line. The problem comes in with how precise the 70 year channel line should be drawn and which precise highs and lows should be connected. That decision can result in a different of 100’s of DJIA points.
Still the chart is interesting because it shows that the DJIA is rallying back up for a second time to the underside of the 70 year channel line but also coming up to long term year 2000 resistance.
The DJIA can potentially bust over and above the long term channel again or it can fail on the second retest under the channel and then start to trend down again.
This is worth keeping an eye on but the problem is again the degree of precision of the 70 year channel line.
I will try to get more zoom and close ups of this chart based on a number of different channel lines.


In reference to the possible Dow diamind pattern.
Bulkowski rates a continuation (17) from this pattern and a reversal (3). The lower the number the higher the ranking.
http://thepatternsite.com/id75.html