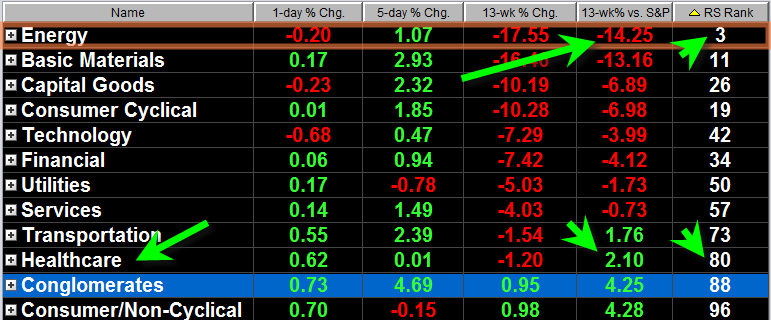
It looks like Crude Oil Futures may be pretty close to low (probably as of today) at the current juncture and could be setting up for a snap back reaction topside rally to end the last week of May. Energy stocks have gotten clobbered recently on the recent down swoon in prices. In fact from a sector perspective the energy sector got clobbered the worst on a relative strength basis for the last 13 week period. Note the strong healthcare relative strength ranking in the chart below. So I think there is an opportunity right now given the current huge sell off.

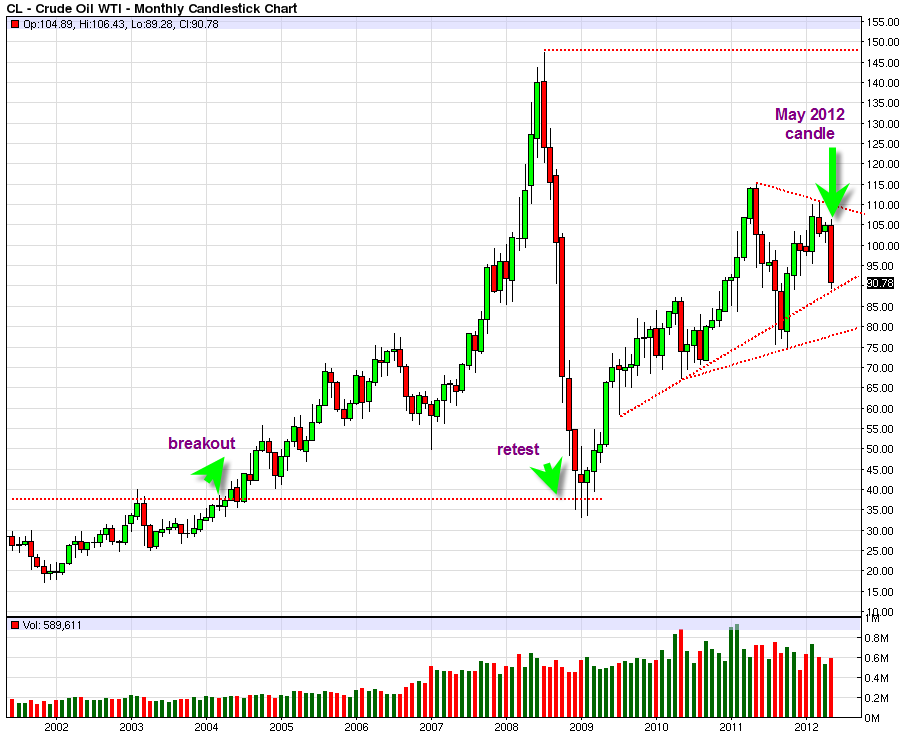
The overall long term chart of Crude Oil Futures still looks constructive and it seems as though it could eventually have a shot at reach the previous spike peak near 147 again.
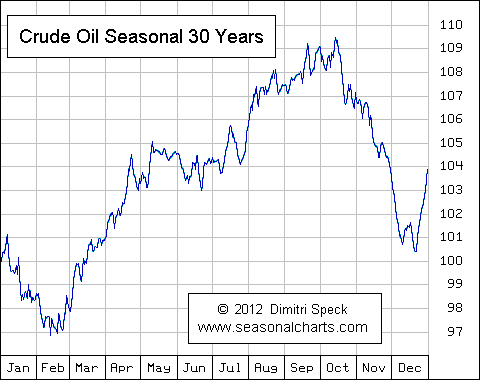
Right now crude oil and many energy stocks are extremely oversold and may be positioned in a unique buy zone before we get into the seasonal strength time of year for crude oil and energy.

The 30 year crude oil seasonal chart from seasonalcharts.com shows that the typical seasonal ramp up phase is from end of June into September.
The long term crude oil price chart still looks constructive and the recent selloff seems to be positioning crude oil for a unique pivot point as we get close to the mid year point.
Long term charts such as XOM Exxon Mobile show a large inverse head and shoulders pattern with significant upside projections. Right now XOM is likely at the bottom of a correction similar to the sp500 index.
The wild card with oil is the potential embargo of Iranian crude oil starting in early July. If Europe engages that measure we could see oil start to skyrocket.
In addition I read a few days ago a link which made up a scenario whereby the oil price could skyrocket more than 400% based on a scenario of Iran closing the Straight of Hormuz. I cannot find the exact link but here is a similar article.
It is like trying to predict the unpredictable, but one just has to put 2+2 together based on what we are hearing now and then visualize how the long term price chart of Crude Oil Futures is shaping up.
The reality is that the long term chart structure of the Crude Oil Price still looks quite constructive and I can envision a scenario whereby oil is able to once again challenge its spike high near 147.

I think Crude oil may have a decent shot at getting back up to its old 2007 high IF it can get kick started to the upside in JULY 2012. It is very difficult to see, but on the crude oil price chart above from February 2011 to present a case could be made that an inverse head and shoulders pattern is forming which would have upside projections of about 30 dollars north from the neckline which would put it back at its old spike high. This is more clearly seen in the long term monthly chart of XOM (Exxon Mobile).
One can only imaging what effect a super skyrocketing oil price would have on energy stocks. I think you would see energy stocks skyrocket right along with the price even if it is only a fast spike to unbelievable heights.
OIL is definitely one to keep on the radar for the second half of this year and its possible effects on energy stocks.
WATCH OIL and ENERGY sector closely for second half of 2012.

