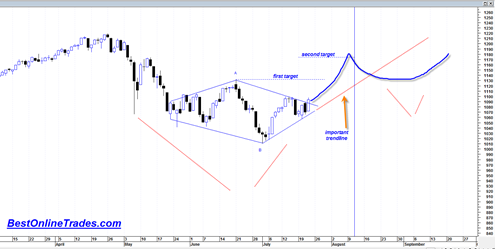
If you have been following my posts you probably know exactly what I am going to say in this post. The bulls won today very clearly and it was a decisive day in terms of volume (276 million shares on the SPY) and price strength at resistance. This was not necessarily blockbuster volume but it was surprisingly robust especially considering the volume pattern since late April 2010. I believe it is time for the bears to raise the white flag and move on. The market is also starting to break out above the diamond chart pattern I talked about yesterday and should now be implying that this diamond pattern was a reversal pattern, not a continuation pattern.
The bearish MACD histogram setup was not confirmed today clearly. Instead we now have a bullish triple P pattern in the MACD histogram and it will be confirmed if we close above 1097.50 either tomorrow or next week. Instead of the MACD failing at the zero line it now looks like it wants to blast above the zero line which is quite bullish. In addition relative strength index is itching to blast higher than the 50 range midpoint, another bullish sign. The summation index which I was concerned about yesterday because it ticked upwards did so again today and clearly shows new momentum is now topside.
Staying with the bearish case because of ‘bad news’ is usually never a good idea. The problem with news is that the mainstream financial media chooses which news items they believe are the most important. But in many cases or perhaps most cases the news items they choose as headliners on a daily and weekly basis are usually just a representation of the crowd mentality and usually the crowd is wrong. So everyone gets sucked into these major headliner news items (ie. Europe debt problems, oil spill) but these news items are not necessarily what the stock market really cares about. The market cares about supply and demand and ultimately the battles will be won or lost based solely on those factors.
The current setup in the market reminds me a little bit of 2003 when the market was all nervous about us going into Iraq to start war. There was confusion about whether the dropping of the bombs would tank the stock market or rally the market. As it turned out it caused the market to rally big time. The series of bottoms leading up to that 2003 turning point was a series of retests each time on lighter volume. This is also what I have seen since the first May 6, 2010 low. A series of lows each on lighter volume. And now we are seeing an upside expansion of volume. If it walks like a bottom, talks like a bottom and acts like a bottom it probably is.


