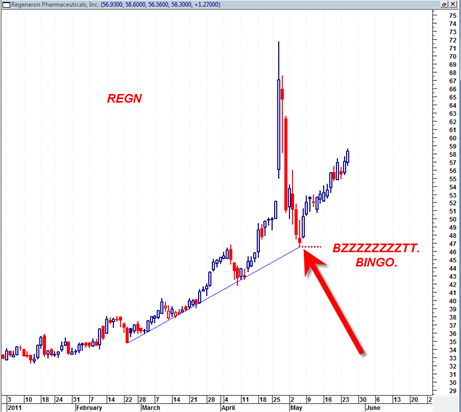
REGN Regeneron Pharmaceuticals Great Example of a Return to Trendline Buy

I talked about REGN a while back after it had made a HUGE high volume spike up.  It ended up doing a mini crash from that level.  But it did something more interesting than that.  It did a somewhat swift return to trendline support which now in hindsight was clearly an outstanding buy.

REGN is a great example of a ‘return to trendline’ buy signal.  Only the most patient would have been able to take advantage of the buy back to up trendline support.  But also those who specifically target this type setup probably did as well.

In fact I think this simple trading strategy could be one of the most effective strategies out there today.  Think about it.  It is very simple and functional and very definable in terms of stop loss.

However not every stock trades in a such a clear linear up trend like this.  So the key is to try to identify stocks that have clear precise and somewhat steep uptrends and then be patient enough to wait for the return to trend line buy.

Read more

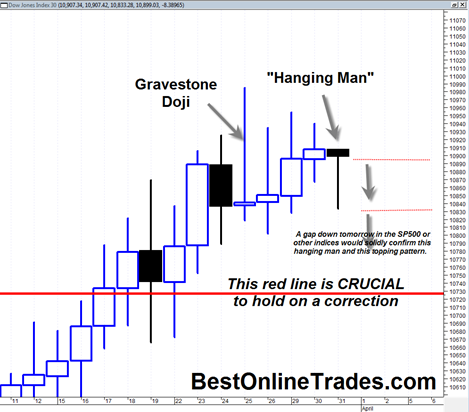
Dow Jones Industrial Average and SP500 show Hanging Man Candlestick

Breaking news development… The Dow Jones Industrial Average as well as the SP500 Index are currently as the time of this posting showing another potential bearish implication candlestick formation. The formation is the bearish hanging man candlestick.  This candlestick looks like a bullish hammer, has a small body shape and a tail that is at … Read more

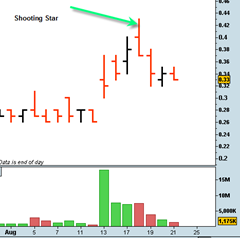
Almost Never Hold a Stock or ETF after a Shooting Star Candle or Price Bar

cegeshootingstar

After a stock has had a significant advance it usually never pays in my experience to hold on after you see a price bar reversal that resembles a shooting star candle stick.

There are specific definitions of exactly how a shooting star candle stick should look.  But in my experience, any price bar that shows a large intra day advance above the days previous high and then closes back under that high and near the bottom of the range is a very bearish short term signal for me.

It seems like almost every time I have seen one of these price bars the next day or few days price action has been very weak and down.

Sometimes these reversal bars can lead to really significant price destruction for a long time.  It all depends in what phase of the trading cycle a stock is in.  But regardless of the phase it is in, most of the time it is prudent to bail out and seek safer waters.

Read more

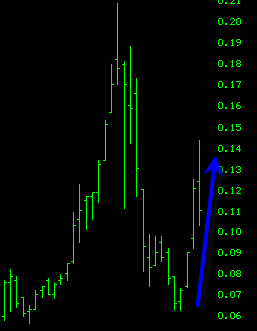
SRSR Sarissa Resources Gets Automatic Rally

srsr20090811

You remember in a previous post ( you can see it in the related posts section at the bottom of this post) I was talking about how I believed SRSR would likely get an ‘automatic rally’ ?

Over the course of the last 4 trading days that is exactly what happened.

In my previous post I was trying to figure out whether or not .081 was to be the final low or not.  I guessed that it would be.  As it turns out .081 was not the final low.  SRSR went into the low .06’s which was a more solid area of support before the automatic rally.

The automatic rally shot up over 100% from the lows and displayed in true fashion how amazing this type of setup can be.  The hard part is figuring out where the final low is.  But even if you had entered at .081, there was still a sizable profit to be had, but it would have required a draw down all the way to .062 before resuming higher.

So it is somewhat dangerous to play these automatic rallies but they are powerful in the aspect that there is tremendous volatility.  The best automatic rallies I have seen are the ones that occur after a massive price collapse from a very strong and long uptrending arcing blow off type uptrend that peaks into a climax.

Read more

What do Animals Have to do with Trading ?

cheetah7

I started a new category here called ‘Trading Psychology’ so that I can occasionally talk about aspects of trading that are more intangible. I can tell you with zero doubt that one of the most difficult aspects of trading that has challenged me time and time again is the tendency towards over trading when there really are not any good trades to be had.

That’s where patience comes in, and that is why I posted a picture of a cheetah in this post waiting in the tall grasses of (Africa?) to scope out its target and see if if can find something interesting to chase.  I don’t know how long cheetahs wait in the fields before they scope out a target and attack.  But I doubt they just run into the field paws flapping everywhere and then just chase and jump on the next moving zebra over the hill. 

They take their time, they scope out a target, they are extremely patient.  Heck most animals and pets I know of are very patient.  Certainly not all of them are, but I would say most of them are.  So it is not just cheetahs.

So most traders can probably learn a lot from the cheetah and most other animals and pets.  Try to avoid rushing to find a trade during the trading day, and then in panicky fashion buying something because it ‘looks good’.

Read more

What I learned looking at 415 ETF Charts Yesterday

Yesterday I downloaded from an online database the entire full list of all ETFS and then converted their symbols so that they could be displayed in my charting program.  I am not too sure why I did not do this before because I can tell you with zero doubt that ETS are really a superb trading and investing vehicle.

You’ve got leverage, liquidity, choice, flexibility, low fees.  I mean what more could you ask for ? Why even bother with stocks or futures or anything else for that matter when you have ETFS?  It is something to think about for sure.  Me personally I like to have as many options as possible, because you never really know where a good trading setup might come from.  Yes there could be a great ETF trading setup, but there could also be a great setup in a penny stock, a blue chip, a Canadian stock, many places!

But I can tell you after scanning through 415 ETF charts one by one in my charting program something occurred to me.  A lot of their patterns look the same and…

95% of them follow what the SP500 does!

It’s true.  Most of them bottomed in March 2009 and most of them have been moving up since then.  Some stronger than others, but their primary direction has been in line with the SP500.  Perhaps this is an obvious point since many ETFS contain sector component stocks which also trade on the SP500.  And some of them just follow specific sectors.  Even commodity ETFS followed the SP500 as well.

Read more