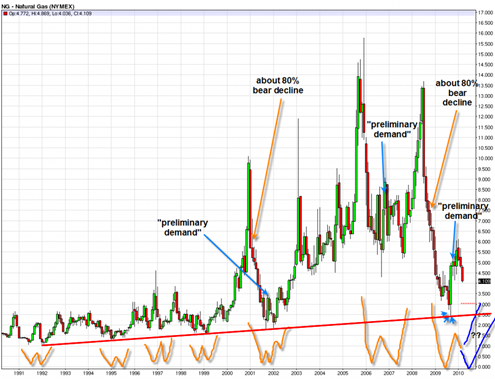
This may be one of the most important posts I ever write. Well, actually scratch that… this may be one of the most important precursor posts I ever write to the eventual ‘signal’ post that I do on the UNG natural gas ETF.
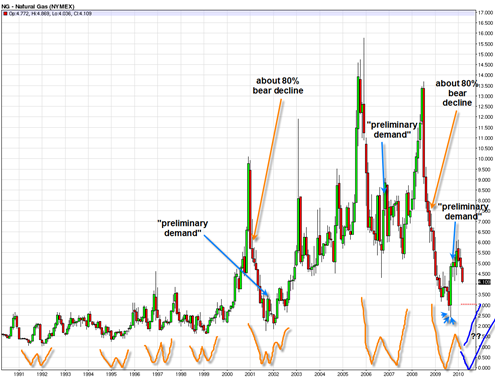
As of the date of this post, it is clear to me that the current most recent trend is down in natural gas futures. The recent natural gas inventory report that came out last Thursday at 10 am helped to kick off another bearish leg down in this all to abundant element. But my take is that there is a lot more to the story than that. There is a larger chart structure that may provide some significant clues as to what natural gas will do in the future. More on that in a moment…
But first I just think it is really fascinating how Natural Gas Futures have been behaving for the last year. It seems to have a completely independent mind of its own and could not care less what oil, gold, or the stock market is doing. This is an important fact and one of the reasons why I like to keep track of what it is doing.
Why? Because it can provide a potentially completely different and much better risk reward setup when most other securities and indexes are all doing pretty much the same thing. That trading dynamic is my favorite one because it potentially allows you to participate in a brand new trend that is in a completely different trading cycle than everything else. It allows you to completely separate from what 90% of what everyone else is doing.

