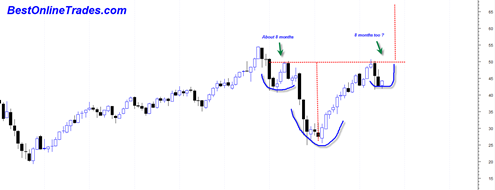
Viking Systems Inc VKNG looks like an Outstanding Position Trade

The more I think about the most probable trading setups, the more I think that position trading is probably the most potentially profitable way to go because it allows you to participate in trends and ‘ride the bull’ so to speak instead of constantly pulling your hair out worrying about every little price tick. Position … Read more

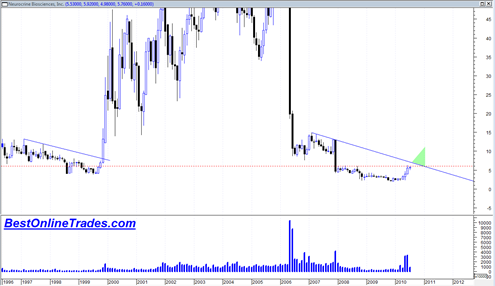
NBIX Neurocrine Biosciences Inc Looks Very Bullish as Position Trade

Like a cheetah in the tall African grasses, I have been watching NBIX Neurocrine Biosciences, Inc for several weeks now.  This biotech stock first caught my eye as I was scanning through the sector lists in the category biotech stocks.  I was looking at each each stock in this sector one by one (there were … Read more

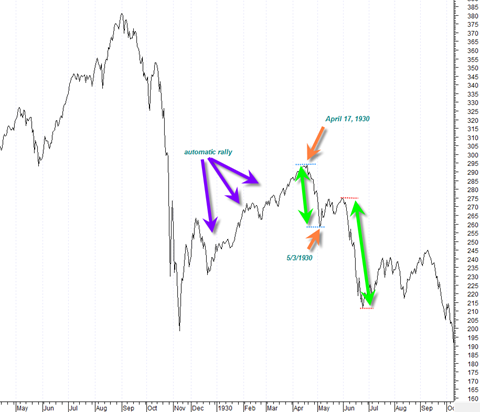
PowerShares QQQ Trust Series 1 ETF Forming A Massive Head and Shoulders

The PowerShares QQQ Trust Series 1 ETF monthly chart is quite an amazing sight to behold.  I just did a post about how the current market structure could be similar to that of the mid 1970’s time frame and could potentially evolve bullishly instead of bearishly. If you look at the long term monthly chart … Read more

Silver Futures Looking Extremely Bullish next 6 to 12 months

If I am starting to sound somewhat repetitive, I am doing it on purpose.  Here at Best Online Trades I like to try to focus on the best risk reward scenarios at any given time.  Sometimes they are short term scenarios, other times longer term scenarios.

What has me very keen and interested right now is the precious metals sector.  And now even more so, the silver sector.  One of the most under rated and under covered sectors worldwide, the silver sector (which includes the silver price itself and the silver mining stocks) may be about to come more alive than any other sector in the market place.

The issue is though which is the best area of silver to participate in assuming a new strong bull leg is coming ?  My own personal take is that the AGQ ProShares Ultra Silver ETF is probably the best way to play the likely coming move in silver.  The AGQ is leveraged twice positively towards the silver price.  So if the silver price manages to make a 100% run in the next 1 to 1.5 years, then AGQ should perform close to 200%.

Now tell me where else in the next 12 to 18 months can you expect a 200% return? In the stock market ?  Bond Market ?  Real Estate?  Probably no, no and no again.

Individual silver mining stocks should get a good run going as well.  But since I have been watching the precious metals mining stocks since 2003 I can say that in general I have been usually disappointed in many or even most individual mining stocks performance relative to the metal itself or even ETFS.  There are just too many uncontrollable variables with the individual miners.  Why take all that extra risk when you have leveraged ETFs? I suppose it comes down to a question of greed since in some cases you will find individual mining stocks (juniors) go up by factors of 2, 5 or 10 of most other instruments.

Read more

This may be the most amazing gold chart I have ever seen

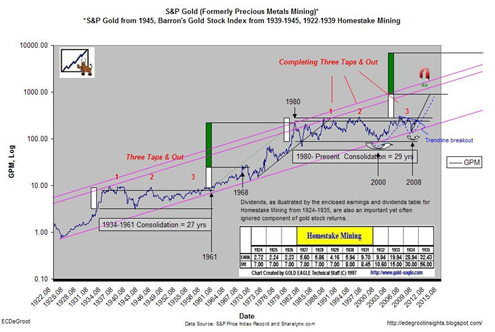
You really need to study this long term gold mining stock index chart.  It was sent to me by a buddy of mine and the chart was made by one of the regular blog posters over at www.jsmineset.com

It is a super long term gold mining stock index chart that goes all the way back to the 1920’s.  What absolutely blows my mind about this chart is that it shows that the GOLD MINING STOCK sector has still not really even had a breakout from the trading range that began in 1980 !!!

This is an amazing chart!

Read more

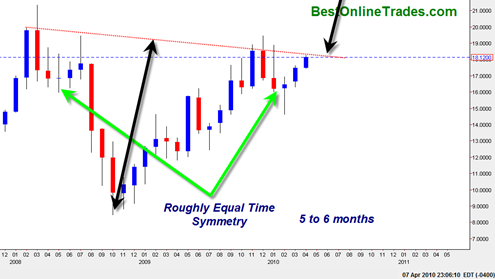
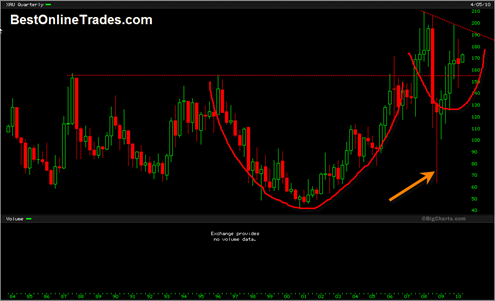
A few Observations on the XAU Mining Stock Index

The XAU Gold and Silver Mining stock index has a reputation for being extremely volatile and choppy.  It is a slow moving beast and is also represented by the GDX Market Vectors Gold Miners ETF. Mining stocks and mining stock indices remind me of biotech stocks because they both seem to trade very erratically with … Read more

Not Short Selling until 50 day moving average crosses 200 day moving average

SP50020100324

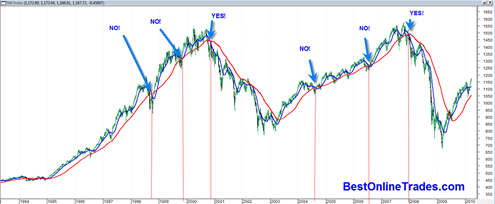
My mindset right now is to absolutely refuse even thinking about shorting this market with inverse ETFS or any other means, until and if the 50 day moving average of the SP500 crosses over bearishly the 200 day moving average.

Now you might say I am ‘slow’ or chicken to attempt to short this market until I get such a long term signal, but I would rather be a slow chicken that takes his time to get on the right side of a trend than super index trading expert hero that feels the need to try to pick the exact top.

For all I know this market may trade all the way back up to the old all time highs in a year or two.  In fact that situation has a decent chance of happening based on simple oscillating stock and index theory alone.

Read more

Another Long Term Chart of Natural Gas

sc 

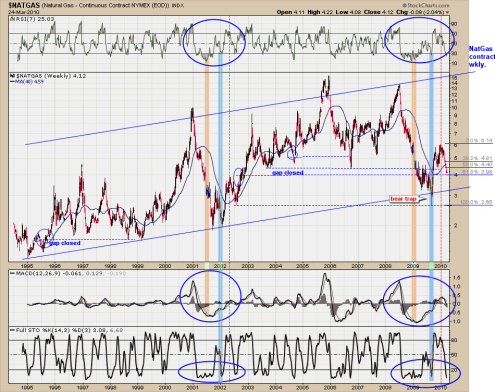
This chart was sent to me by ‘Michael’ and is a nice piece of chart work on on the natural gas contract so I thought I would repost it here and let it basically speak for itself.

When I look at this chart it has me thinking that the bottom in Natural Gas may be sooner than I realize because when I look at the pattern of 2009 and 2010 and then compare it to the pattern of 2001 and 2002, one could make the argument that we have ALREADY made a W Bottom and now we are simple making a similar ‘handle’ as we saw in the 2002 time period.

Also significant is that we are right now near the 61.8 fibonnaci retracement level near the 4 range.  That 61.8 fibo level may provide some significant support to the natural gas contract as we close out the month of March.

Read more