I Will Stay Bullish On Spot Gold as Long as the Break Out Area Holds

spotgold20090921 The GLD ETF declined today on what I consider to be light volume.  I think it is going to go into a sideways consolidation this week with an outside chance of a sharp reversal move up topside later in the week.  The setup still looks contructive to me on both the GLD ETF and the spot gold price.

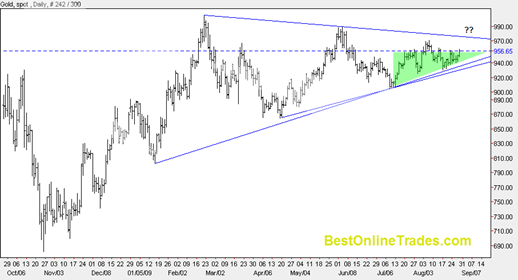
In the chart above as long as the spot gold price holds above the 988 level which is approximately where the long blue key support line is, then I will remain BULLISH on gold for the rest of September and the last 3 months of this year.  Spot gold already did the job of breaking above this line on big volume, but not blockbuster volume.  We could pull back all the way to 990 and I would still be bullish. 

It is possible that we could enter a sideways trading range for some time but we do still have the very bullish seasonals until the end of this week and at various other time frames into the end of this year.

Why be bearish on spot gold if the chart is not telling you to?  The charts do not lie and I am not going to doubt this spot gold price chart.  Obey and stay above the breakout area, then I am happy to be a gold bull.  Break under it, then something else is going on and the bull case is delayed.

Clean. Simple. Effective.

Read more

Natural Gas Futures are Plunging and so is the UNG

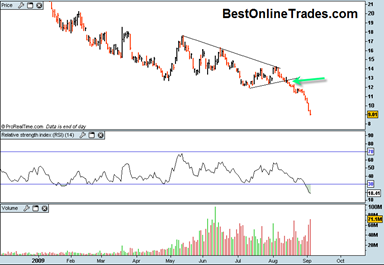
NGAS20090903

But is there a bottom to be had in Natural Gas yet?

I think it is too early still.  The UNG has shown no signs that it wants to get a reversal going.

However it is clear that with the relative strength index at 18.49 we may be near a possible turning point.  There is also a full moon tomorrow and I have seen many times big reversal occur right on full or new moon days.

A highly speculative short term turn around scenario would be if the UNG gaps down at the open or just simply plunges at the open 10 to 20% bringing the daily RSI value even lower to perhaps 15 and change.  Then after lunch a reversal begins and a full reversal price bar that closes slightly positive.  That could be a first sign that the UNG is ready to start some sort of near term turn around.

But even if it does that, I suspect it will not be able to get an upside run going until at least a small double bottom forms and RSI starts to base out and develop a stance that eventually enables it to cross above the 30 level.

Read more

The Gold Price Initiates Breakout from 30 Year Cup and Handle Pattern !

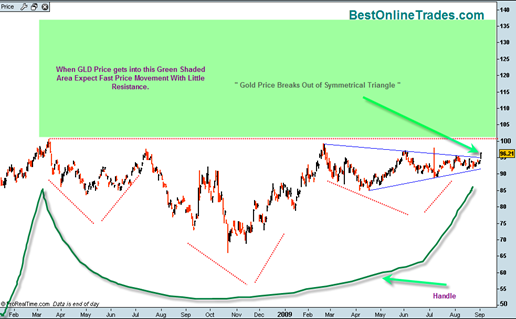
GLD20090902

I am only going to do one post today and it is going to be on the GLD ETF because I want to emphasize how important a day it was today in the gold market.

Today we broke out north from the large symmetrical triangle with confirmed volume and confirmed sign of strength.  The triangle formation has been developing since February-March 2009 time frame.  This is quite a large triangle and has significant cause for an extended move.

But there is even better news.  This symmetrical triangle also makes up the right shoulder of the much larger head and shoulders bottom formation that has been in existence since March of 2008.

And there is even more better news.  The entire head and shoulders bottom formation of approximately 1.5 years in duration is in itself the handle of a super large cup and handle formation which is 30 years long.

Read more

Today was an Absolutely Huge Day for Gold

gldetf20090901

Today was a huge day for gold and the GLD ETF in my opinion!  Gold got a nice bid today and held firm.  I consider it to be a possibly pivotal day for the gold market for two reasons.

The first reason is that despite the broad market break down today, the gold price (as represented by the GLD ETF) held firm all day and managed to trade up by about .60%.  I hinted about this when it happened a few days ago and could be the early signs that foretell a scenario where the gold price becomes less “co dependent” on the broad market for its direction.

The second big reason I consider today to be a pivotal day for the gold price is because gold was able to trade up today despite the significant US dollar strength we saw throughout the day today.  So we had the broad market down big, the US Dollar UP big and the gold price holding firm and managing to get a nice upside close. 

Read more

Gold Price to Break Out by Labor Day?

goldfutures20090828

Spot gold has some good upside action today but it is still early and we still do not know how the day will end.  But so far today I am seeing bullish signs and a good possibility of a bullish closing weekly price bar to set us up for next week.

It would be superb if we can get a bullish weekly close going into next week.

I am seeing that the daily MACD has crossed up on the spot gold price for the fourth time since being in this large triangle.  In the near term there is a slight tendency to an ascending triangle formation (green shaded area) in the chart.

Still, the spot gold price has not achieved a move above the 970 to 980 area that is necessary for me to say we are in breakout mode and have much higher confidence that the breakout is for real.

Read more

Gold Market May Achieve 30 year Cup and Handle Breakout Next Three Weeks

TsarCannon

I continue to get more and more bullish on Gold with each passing day.  The only thing constraining a truly rampant bullishness is this large symmetrical triangle you have heard me talk about repeatedly over the last few weeks.

If the GLD ETF can get above 95.25 during the next three weeks and if the DGP Gold Double Long ETF can get above 21.50 during the next three weeks then I am going to have to make the conclusion that the massive 30 year cup and handle breakout is in full force and we should then get a long term upside continuation breakout of between 6 to 12 months duration.

Read more

GLD Declines Today but on Lowest Daily Volume since Christmas 2008

gldgoogle

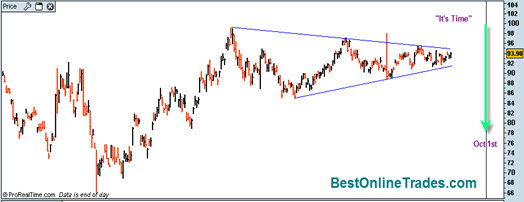
The GLD was down slightly today but the volume was the lowest volume we have seen on the GLD since Christmas 2008.  The volume today was 3.97 million shares.  For the GLD this is the equivalent of holiday trading volume.

This is significant to me for a couple of reasons.

One of them is that it confirms the fact that we are right inside the apex of this large symmetrical triangle on the GLD since February 20th, 2009.  Volume declines into the formation of a symmetrical triangle is expected.  During the entire formation of the triangle, the bulls try to rally price higher and then the bears slam price lower in successive steps each slightly higher and then lower as the pattern progresses.  It is a frustrating pattern because it seems that no significant progress is being made either up or down.

But progress is being made in the sense that significant cause building (energy) has occurred which will eventually see a resolution.  My bias has been for an upward resolution out of this pattern.

Read more

GLD ETF breaks down below rising channel

gld20090817

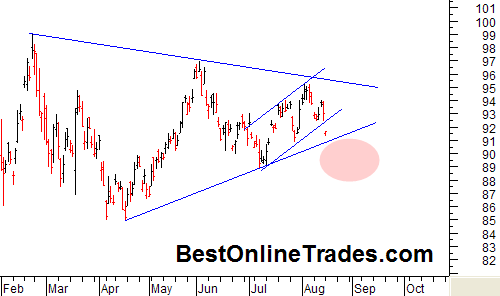
The GLD ETF has broken down below the short term up trending channel which was leading to a breakout out of this large symmetrical triangle pattern.  Gold clearly wants to test everyone’s patience and throw another curve ball at us.

The break down in the GLD today coincides with a breakdown in the broad market and a big move up in the US Dollar.  The GLD is still within the large symmetrical triangle and it is looking like it will come down to test the bottom of this symmetrical triangle.  I really would like to see it hold. 

If it does not hold then something else is going on in the gold market and I may have to rethink bullish possibilities.  I would like to see the GLD ETF hold above the 90 level and most certainly above the 89 level for me to still stay constructive on this market.

Read more