Natural Gas May be Bottoming Sooner than Originally Thought

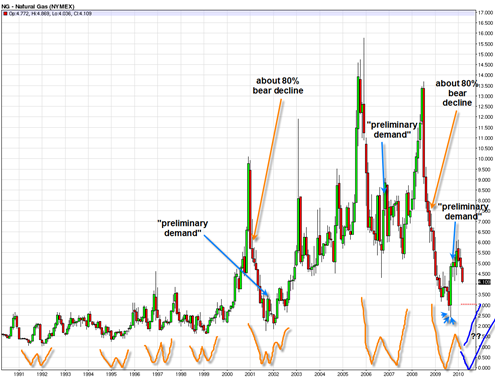
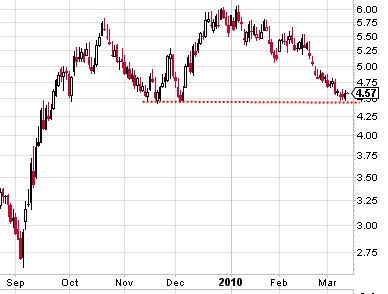
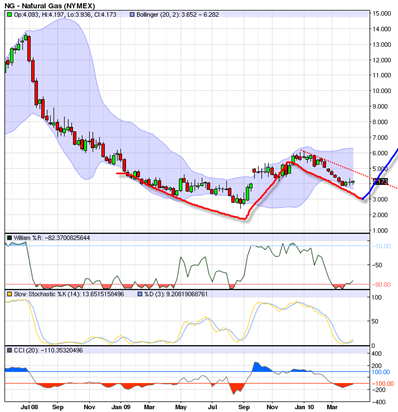
I am still watching the Natural Gas Contract fairly closely.  I thought originally that Natural Gas Futures would trade down near the 3 level as a final bear market low.  But there are a few elements in the current chart that have me at least considering otherwise at this point.

The the weekly chart of Natural Gas is used along with the Bollinger bands it paints a possible picture of a large W bottom forming with the Bollinger bands serving as support.

I recently just read over John Bollinger’s book on Bollinger Bands and he indicates through his book the identification of W bottoms along with the Bollinger Bands as confirmation.

He indicates that one might at first see price move out side of the Bollinger bands to create the first portion of the W bottom, then some type of rally can occur and then a retest of the Bollinger Band that does not break through the second time.  the second retest is also typically right portion of the W pattern before the new uptrend emerges.

Read more

SPDR Gold Trust (ETF) warming up for a big move

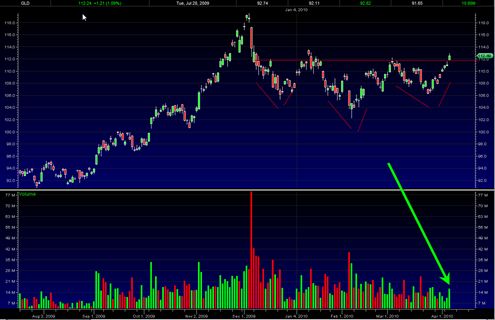
I suspect that a big move is coming in the gold price and the GLD ETF (SPDR Gold Trust).  Today gold behaved extremely well in the face of the first general stock market decline in over a month.

It could very well be that the gold price will begin to trade with relative strength to the stock market as the stock market is extremely overbought right now.  In fact I would not be surprised to see the stock market start to head south for the long awaited correction and then see the gold price zoom higher totally ignoring what the stock market does and even using a decline in paper assets as more fuel to the fire.

The daily and weekly charts on the gold price look outstanding and I continue to believe that right now…

Gold and Gold Shares are Much Better Risk Reward than the General Stock Market right now!

The reason for this is simple.  Gold has been in a corrective phase since early December 2009.  This is a long time by trading standards no matter what security or index we are talking about.  This consolidation time for gold has put it in a position to head higher regardless whether or not stocks keep going up or start a correction now.

The gold price has led the way in breaking out to new all time highs and the stock market has LAGGED the way trying to catch up to the gold price but so far not even coming close to achieving it.

Read more

A few Observations on the XAU Mining Stock Index

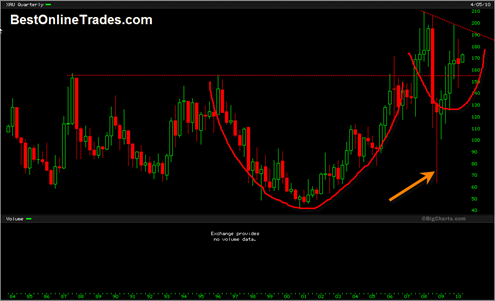
The XAU Gold and Silver Mining stock index has a reputation for being extremely volatile and choppy.  It is a slow moving beast and is also represented by the GDX Market Vectors Gold Miners ETF. Mining stocks and mining stock indices remind me of biotech stocks because they both seem to trade very erratically with … Read more

Going Long the ProShares Ultra Silver ETF Today

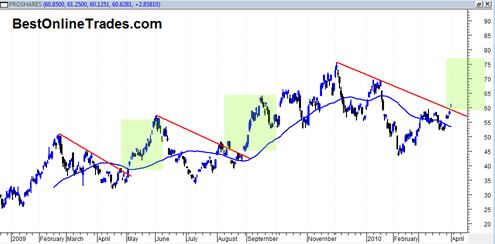
Today I went long the ProShares Ultra Silver ETF (AGQ) which is leverage 2x the amount of silver.  If silver moves up 1% then AGQ attempts to move up 2%.  I need to put my money where my mouth is.  In a previous post I talked about how previous metals seem to have a better risk reward than the broad markets right now.

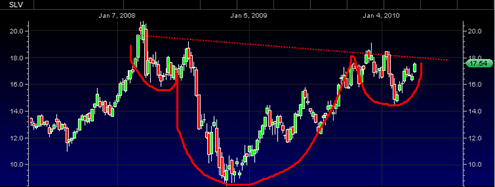
I went long the ProShares Ultra Silver ETF because I want to be early in what I see as a potential big move coming for the precious metals.  Silver has been the ‘slow dog’ in the bull run and to be honest has been severely lagging the move in the gold price so far. 

Having said that, there are two separate takes to explain this. 

One take is that because silver has been lagging the gold price so badly it means that the entire precious metals run is in doubt because silver is not confirming the move in the gold price so far.  This would be known as ‘non confirmation’ similar to the way the Dow Jones Transportation average either confirms or does not confirm the move in the Dow Industrial Average.

The second take is that although silver has been lagging gold, it is just a matter of time before silver plays ‘quick catch up’ to gold and confirms the final blow off move in gold.  This would mean that the price of silver must get an extraordinary rally going in the next year to the 50 dollar range and even beyond that level.  Why? Because the price of gold is already trading at lifetime highs and has already exceeded the old 1980 price high of 850 to 900.  Silver’s high in 1980 was in the 40 to 50 dollar range and so in order for silver to catch up to the gold price it needs to get near those record levels.

This will take some time though assuming I am correct with the ‘second take’.  But it is also important to keep in mind that in many later stages of commodity bull markets 90% of the move can happen in the last 10% of the time.

Read more

Time for a Change in Trading Strategy Towards Gold and Precious Metals

I am a bit frustrated with the stock market indexes right now.  In fact to be honest with you I am sick of them.  There are still opportunities on the long side on plenty of individual stocks (Las Vegas Sands Corp is one of them), but in my opinion it is too late to jump into the long side of any indices, even if they do go to 1200 to 1250 on the SP500.

Where is the risk reward ?

The risk to reward ratio on the indices right now seems like it is close to 2 to 1.  Two ounces of risk for every ounce of reward.

Now as far as the short side of the market and the inverse ETFS such as the Direxion Daily Small Cp Bear 3X Shs (TZA) ETF, it would seem that this inverse ETF still offers some good risk reward to the upside.  But the problem is that today’s close in the indices was still more of the same.  Inching higher like slow water torture 1 point, 1 day at a time for the next 30 days.  That trading dynamic can go on for a long time and to be honest I don’t know when it will stop.

So that means that despite the apparent  good risk reward in the inverse bear ETFS, unless they start performing from the get-go next week, it will be more of the same as their inverse dribble down relationship mirrors the dribble up move of broad market indices.

Read more

The UNG Natural Gas ETF is Going into a Death Spiral

This may be one of the most important posts I ever write.  Well, actually scratch that… this may be one of the most important precursor posts I ever write to the eventual ‘signal’ post that I do on the UNG natural gas ETF.

As of the date of this post, it is clear to me that the current most recent trend is down in natural gas futures.  The recent natural gas inventory report that came out last Thursday at 10 am helped to kick off another bearish leg down in this all to abundant element.  But my take is that there is a lot more to the story than that.  There is a larger chart structure that may provide some significant clues as to what natural gas will do in the future.  More on that in a moment…

But first I just think it is really fascinating how Natural Gas Futures have been behaving for the last year.  It seems to have a completely independent mind of its own and could not care less what oil, gold, or the stock market is doing.  This is an important fact and one of the reasons why I like to keep track of what it is doing.

Why? Because it can provide a potentially completely different and much better risk reward setup when most other securities and indexes are all doing pretty much the same thing.  That trading dynamic is my favorite one because it potentially allows you to participate in a brand new trend that is in a completely different trading cycle than everything else.  It allows you to completely separate from what 90% of what everyone else is doing.

Read more

I am starting to get very Bullish on the gold price and the GLD and DGP ETF

gld20100304

The gold price has a habit of doing these long slow consolidations and putting everyone to sleep when they should be sitting on the edge of their seats eager to buy with both hands.  It also seems to get the beginning of big moves going on slow days of the week (Friday or Monday or near holidays) when a lot of people are not paying as close attention as they normally would.

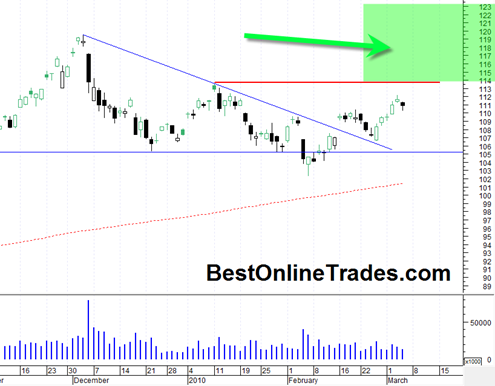
I am bringing up the GLD ETF again because if the GLD is able to trade with a full price bar above the 114 level then in my opinion it warrants a confident move into the bull camp again.  However anything below that is still too risky.  Gold also has a habit of rallying up to previous swing trading ranges and then falling apart.

So 114 and higher on the GLD tells me it is time to jump in with both feet into either the GLD or the DGP ETF (the gold double long ETF).  The condition is that the GLD must continue to hold above 114 from there onward.  If the GLD is strong enough it will hold above that area and any pullbacks will be slight enough to keep it from falling under the 114 again.

Read more

UNG Natural Gas ETF Still Has an Interesting Price Chart Setup

UNG20091214

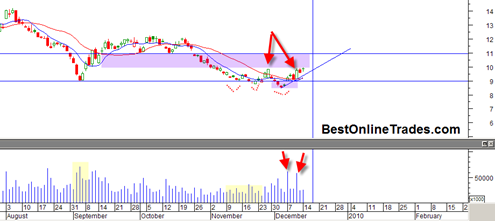
I continue to be long the UNG natural gas ETF since I first mentioned going long at 9.38 on December 8th.  Despite all the negatives you will hear on stock message boards and elsewhere about how no one needs Natural Gas anymore, the chart is quite compelling to me.  There is so much negativity on this ETF right now that just based on that alone it is at least worth a look.

Did you know that if the Dow Jones Industrial Average was up the same percentage amount as the UNG ETF was on December 10th, 2009, the Dow would have been up about…

787 Big Dow Points in One Day!

So my point is that the market is always throwing you different pitches, each with a different risk reward.  Where the risk appears to be the highest it is often the least, and where the risk appears to be the lowest it is often the highest. 

Read more