I have been reviewing the gold price charts recently up to the monthly scale charts and I am seeing enough evidence to suggest that gold is about to head downtown for quite a while.
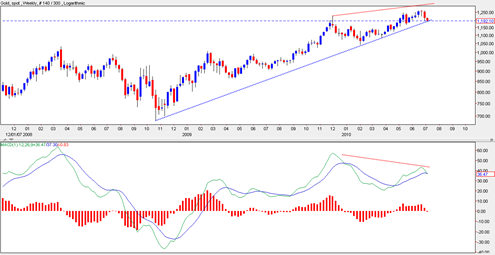
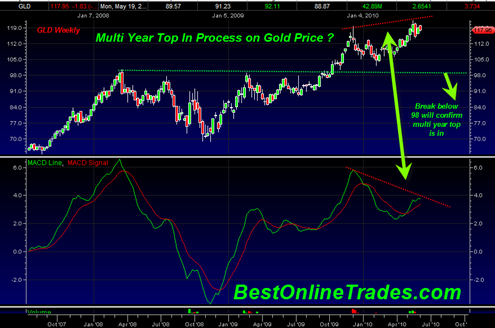
There is a class C (as defined by Alexander Elder) bearish divergence (between price and MACD) on the WEEKLY scale that looks confirmed to me as of today. Of course the week is not finished yet, but I am sticking my neck out and will say this is a confirmed bearish divergence right now. The only way the gold price can avoid this class C bearish weekly divergence is by blasting high by the end of this week well above the 1200 range.
Class C bearish divergences are known to be some of the strongest signals in technical analysis according to Alexander Elder. And this is not a daily bearish divergence, it is a weekly one. So that means it should have price trend implications for several months. The divergence formed over an almost 1 year time frame which gives it a good amount of significance.
If you just look at the price one can also clearly see that it has printed a 2B sell signal on the weekly chart which is another bearish sign and can lead to a swift cascade down in price.
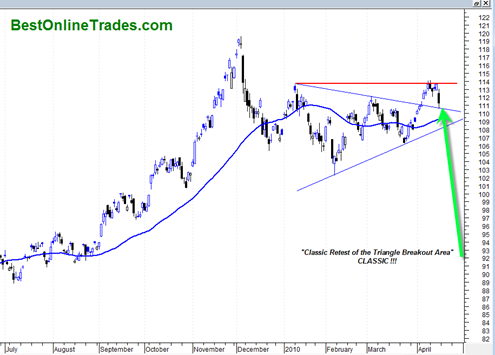
The chart below shows the two red dotted lines that define the divergence and also note the blue uptrend line on this log scale chart that shows price close to breaking down through an almost 2 year uptrend.

