Today we saw big price destruction in the sp500 which gave back a good portion of the hard earned gains of last Friday’s reversal. I was looking for a confirmation of last Friday’s bullish reversal today but clearly we did not get anything close to a confirmation today. Instead we got a deep retracement that has to be truly testing the resolve of any bullish opinions.
Today the ARMS index closed at 3.8. Not a record closing number but still in the high range of recent months. And despite today’s high reading I do not see any new lows being taken out, not yet at least.
I have been trying to get into the mind of the market so I can figure out what it has in store for us this week to close the week out going into Labor Day Weekend. I am suspicious that today’s big drop and ‘give back’ of the action from last Friday is the beginning of another big down leg. It just seems too convenient to give the bears everything they hoped for right on a low volume Monday to start this week.
The summation index still looks bearish and is in a downtrend but has not crossed below the zero line again (not yet at least). The volume today was very light across the board which is part of the reason I am skeptical of the bearish action today. Yes, we had plenty of price destruction, but where is the beef ? The volume was absolutely pathetic today.
The volume analysis I did before still stands and is one of the main criteria that is keeping me bullish right now. If this volume analysis does not work and not show some more bullish price action the rest of this week I might have to throw it under the bus.
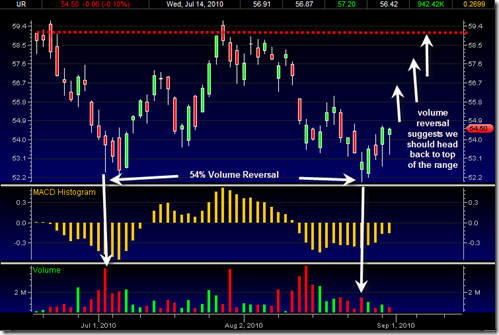
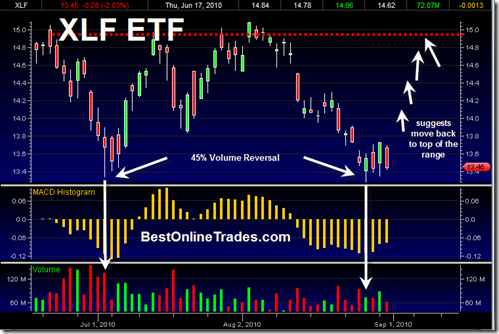
Both the XLF, the SPY and the IJR did recent volume rests and reversals on 44 to 54% LESS volume and then closed back higher into the range. So despite today’s big points drop, the volume analysis still holds in my book. I have seen volume tests on 10% lighter volume that lead to big reversals. But 50% volume reversals are rare and usually very strong signals.
The sp500 needs to bust through 1040.12 with strong conviction to flip me over to the bearish side again. The XLF needs to bust down through 13.29 on a closing basis and the IJR (The S&P 600 small cap ETF) needs to close below 52.01. If all three of these events occur during this week sometime then I will have to raise the white flag and declare the volume analysis a complete failure.
These volume reversals to me suggest that we should be heading back up to the top of the swing trading range. The swing trading range is so large at this point that it could mean quite a large upside move. The IJR chart is below:
I realize that is seems unthinkable that the indices could move back to the top of the range from a fundamental standpoint. I too have a hard time believing that such a thing could be possible at this point. Still, I am a very fearful long right now, but I will pull in my horns should the market tell me to do so in the days ahead.
But for now I am sticking to this forecast. The IJR really looks quite strong to me in the chart above. These small caps can show earlier signals than other large indices. I am thinking the IJR will show the way for us.
The XLF daily chart below shows the same type of situation.
If I am correct then we should start to see some big signs of strength soon this week in the form of 20/20 candlestick bars also known as ‘belt hold candlesticks (wide price spread and closings near the highs).
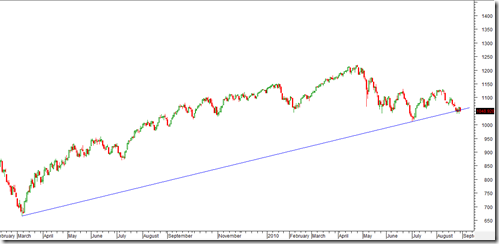
A close look at the longer term sp500 chart shows that the sp500 really needs to start going up very soon otherwise it will be at risk of breaking the long term up trend line since the March 2009 low. We are touching this long term up trendline for the third time which makes it significant. We rejected it last Friday and bounced off of it sharply previous to that. But this time we are hitting it on light volume and we have yet to see a strong reaction topside off of this line. I have to admit that a big down week this week is going to bust this final bull market trend line and could perhaps seal the bear case. On the other hand a strong topside reaction off of this trend line once again will confirm its strength and bode well for higher prices in September.
My biggest confusion over the years has to do with being able to separate the technical aspect of the market with the fundamental and news side of the market. The news out there right now makes me feel like the market should drop 2000 points this week. But the chart is telling me the exact opposite… and so the journey continues…
P.S. My posting this week may be somewhat lighter than is usually the case. Expect posting to be at regular speed after the Labor day holiday weekend.


This market’s all about guessing what ‘they’ are up to — and today’s action was pretty telling. And, given September’s notoriety and some historically awful fundamentals, bears can turn this into a bloodbath any time soon.
we are making lower highs,ema’s are in bear mode,economy is in trouble and even the Dax has turned down….could be dangerous to intellectualise too much on the basis of historical manipulation ?! good site !
Agreed Max, but the bears need to come up with some big down volume very soon otherwise we could flip topside sharply again…
Looks like we are doing just that!