Have you ever thought what might cause the gold price to go truly parabolic (aka vertical) ? It seems that the personality of the gold price is one of parabolic structure. That was the case in the 70’s and so I see no reason to believe this will not be the case now. It probably will.
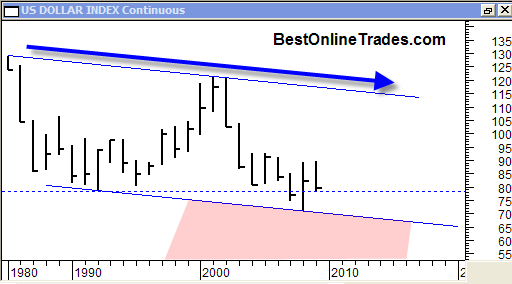
The chart above is the US Dollar Index chart plotted with YEARLY price bars. It should be quite clear that this is a very long term price chart since it takes a whole year just to complete one price bar !
My point in plotting this chart is to point out that the US Dollar for the longest time has traded in a somewhat declining trading channel. I mentioned over the course of the last few weeks that the dollar was at risk of breaking critical long term support. That still appears to be the case now. However, as you can see even if the dollar breaks down to the 70 level it will still be within this trading channel.
It has me thinking that what could truly set off the gold price to the upside in near vertical fashion would be a break of this trading channel to the downside in the red shaded area on the chart. That would be the ultimate violation in my opinion and one which could send gold futures skyrocketing. Not that they cannot still skyrocket on a dollar index move to the 70 level, they can. I am just throwing out the option that a downward break below this channel would truly be the most ultimate scenario for a near vertical lift off for gold.
If the bottom of the channel is broken then it would turn into long term resistance, and remember we are talking about a yearly price bar chart here so the implications time wise are very significant.
