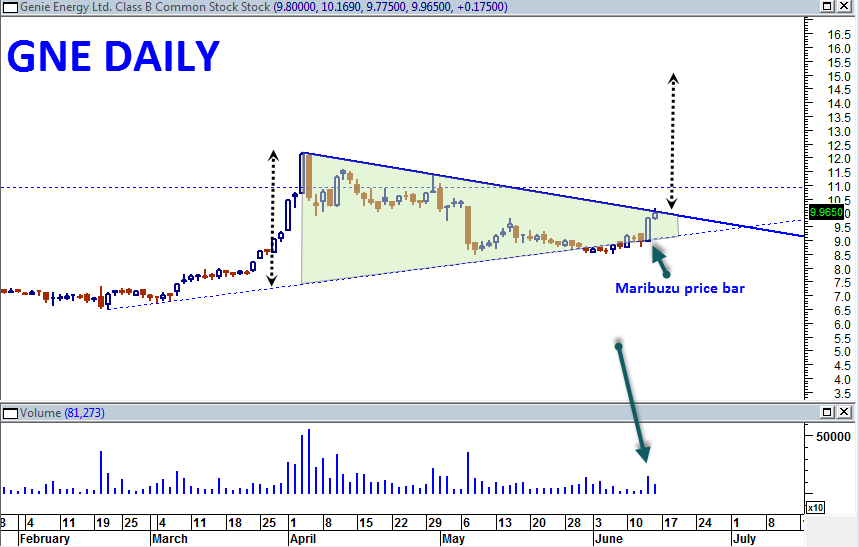
GNE or Genie Energy has a nice compressed triangle and recent positive price action which includes a high volume maribuzu price candlestick.
The Oil sector is important to watch in the coming 1 to 3 months as the 30 year seasonal charts show that Oil should have strong upside bias going into August. That should help support oil stocks and sector. Recently Oil has made 1 month price highs and continues to show resilience.

The important aspect of the GNE chart is to focus on the near term price candle (today’s candlestick). It is attempting to break up and through the price downtrend. So far it looks like it is having a bit of a hard time, but I do think the down trend line is weakening as a result of today’s action. GNE should be watched closely for signs of a successful break of this downtrend resistance.
If we see a successful break of the downtrend, GNE could move into trend mode back towards the old high near 12 and then attempt new 52 week highs into the low teens.
It has reacted nicely at the uptrend support line near the 8.50 range.
GNE is under close watch to see if it has the ‘right stuff’ as we move into next week.
