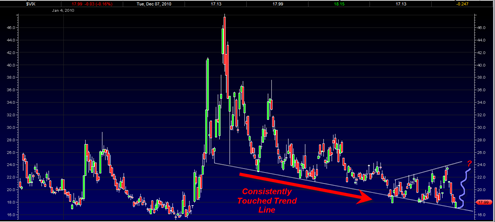
The volatility index has been trading for a long long time quite consistently along a somewhat steep down trend line. More recently it has formed a nice expanding triangle formation. Right now the VIX is trading right at the bottom of the range of both the down trend and the expanding triangle.
Today it managed to cling onto support and trade right back inside the range.
I would sat that the VIX really needs to start trading higher from today’s levels to maintain any remaining sense of a new bullish trend. If we break below today’s low then it potentially launches the VIX into a new bear channel and puts it in an even weaker state than is currently the case.
The down trend line has been touched many many times and I view it as a very significant level for the VIX. This is why today’s reversal in the VIX was so key.
I think the VIX is worth watching closely for better clues on broad market possible trend change.


Expanding triangles are mostly bearish patterns. Looking for this to break down sending the market upward and onward with the FED’s help
On the S&P 500, which had a consolidation into a triangular apex, I trace a five wave up, with the movement today indicating a five wave down.
I closed my long positions early this morning with a small profit. Went short LVS at 47.50 and covered at 45.70. I am flat as of now!
being flat is a great position to be in ! Amen to that 🙂