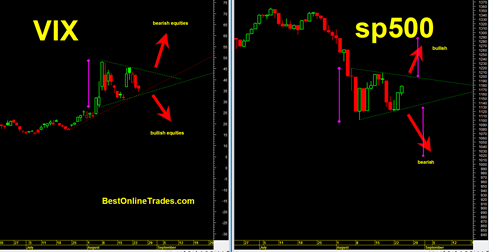
The sp500 finds itself in a volatile trading range. I have gone back and forth in my mind trying to determine bullish scenarios and bearish ones. When I start to contemplate a near term bearish scenario (like lots more downside within 5 trading days) I run into the problem of the market being very oversold and overdue for more bounce.
When I contemplate the bullish scenario I start to wonder where the buyers will come in heavily and then realize there is a heavy resistance at 1200 where it would seem likely to see a lot of sellers again. I think there are plenty that want second chances to get out of the market.
So I look at the bearish and bullish side of the market and unfortunately at this point I have to leave it to a 50/50 coin toss. I can make equal arguments right now for a massive surge higher and a massive surge lower.
But I should say that I have a slight bias of more upside and a possible surge higher so the market can revert back to the mean. There are enough indicators that are so deeply oversold that it only seems logical for at least a little bit more upside action to work off the oversold levels.
The trading action of the last several weeks has formed powerful symmetrical triangles in both the VIX and the sp500.
Either the VIX or the sp500 is going to win this battle. I do not know which one.
If the VIX blasts higher out of the symmetrical then it would suggest the sp500 will blast LOWER in a bearish symmetrical triangle continuation.
If the VIX blasts lower out of the pattern, then it would suggest the sp500 blasts HIGHER out of its pattern leading to a huge upside move.
The bottom line is that there is a huge move coming on huge volume.
The premise of the symmetrical triangle is that most of the time it is a continuation pattern. So the previous trend before the triangle is likely to continue after the break out. This would suggest a major break down out of the pattern in the sp500.
The measurement of the pattern in the sp500 projects to about 1000 in the sp500.
I did a google search for symmetrical triangles that act as REVERSAL patterns but could not find any sites or information that showcases examples of it happening. I guess it is extremely rare.
To complicate matters, sometimes there occurs a busted pattern where you see an initial breakout in one direction, but then in short order a reversal back inside the pattern and then a move in the opposite direction.
This market is so crazy right now that I would not be surprised to see a busted pattern setup develop.
In the near term I am thinking that this Friday could be an important high or as late as Monday the 29th August 2011 could be that important high.
But until then I will keep watching this pattern like a hawk and provide updated interpretation as the pattern develops and maybe some new conclusions can be reached…

