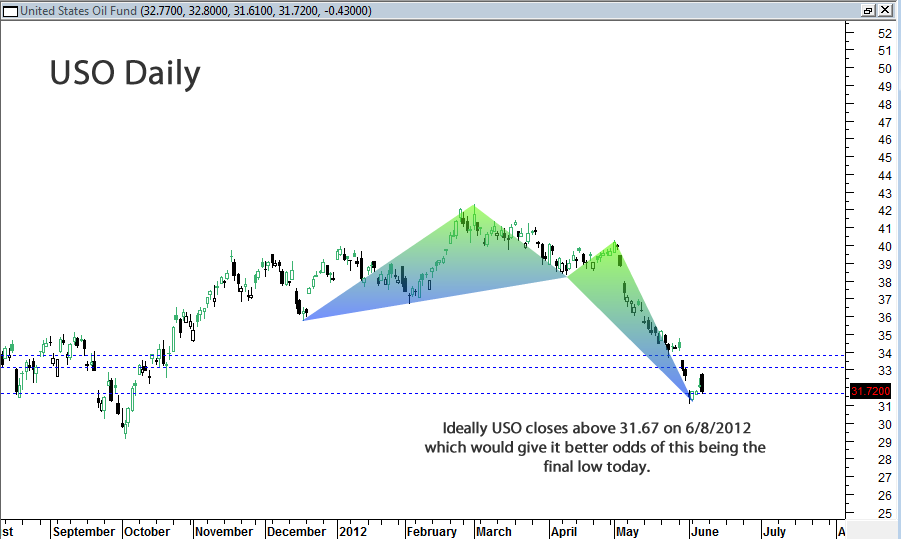
If the USO ETF can manage to close much higher today above 31.67 then I think it would help to confirm the chance that the USO has made a bottom here. But this is a tough call in this zone. The USO has completed an important Fibonacci pattern but 31.67 is really the last level of support.
Today USO gaps down in what I think could be an exhaustion gap to the downside.
The previous swing low is at 31.03, so with a stop loss just under there, downside risk seems limited to about .67%. Of course USO could gap down again next week starting Monday which would make the .67% stop loss invalid.
So the question is, did USO bottom today or not ?
The weekly chart is showing that this weekly candlestick is a large inverted hammer candlestick which often times show a market has reached bottom.
This is a very tough call, but in order for it to have best chances of working USO must get back above 31.67 by the end of day today. That would be the most ideal situation for a bullish setup to start next week.

The ERX ETF is holding up much better than the USO, but it might be a bit of stretch to conclude that the ERX is going to or is already leading the USO higher.
This is nevertheless an interested setup in terms of risk reward.
Downside risk here seems limited to under 1%, with topside much more than that.
I could be completely wrong here, but I think the risk reward looks quite compelling at this juncture for both ERX and USO.
