If you think about it, Friday’s Market action (10/23/2009) was extremely revealing. Just forget about technical indicators for a moment and pretend you could only make a judgment call about the future market direction from the tape action of this single day on Friday. What would you conclude?
Microsoft was gapping up, Amazon.com was doing a huge gap up and this was of course following the gaps and runs of Google and Apple. All of these moves came on huge volume. But the market was down on Friday? Wait a second, what is wrong with this picture. The market should have been up huge on Friday because of all the optimism. But this was not the case at all and looking at the Mclellan Summation index showed you that a huge portion of the rest of the market basically said “F U” ! to the bullish news.
So my take is that the big money is selling now very heavily into the retail money buying the good news. The moves up that were seen in Amazon and Microsoft and a handful of other bellwether stocks could possible be exhaustion moves up on high volume or exhaustion gaps up that mark this peak of the market up cycle. In effect it is almost a polar OPPOSITE of what we were seeing on the March 6, 2009 low. On that day everything was reaching a selling climax. I remember on that day we saw general electric trade close to 1 billion shares in a massive selling climax volume day. Remember that day? It seemed like the end of the world for GE but the tape action and the all time record high volume that day in GE painted a picture of a selling climax where everyone who wanted to sell did so.
But now we seem to have the polar opposite situation where everyone who wants to buy has already done so and now there is pocket of air under the market.
So looking beyond this tape reading here is yet another clue that this last week of October could be a ‘very bad’ down week. And if you are a bear, the best case scenario is for a move to the 1030 range on the SP500 as a next Friday close. The clue is once again the US Dollar Index which everyone seems to be bearish on.
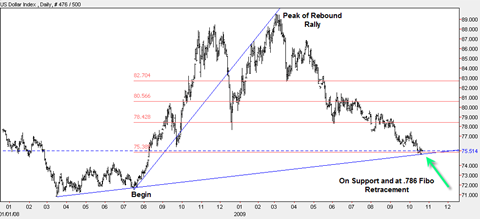
For starters the US Dollar index still is in the range of a .786 fibonacci retracement of the entire rally since the 2008 bear market bottom. If you look carefully on the chart below you can see that the US Dollar Index initiated some violent upside moves once it hit the .382 and .618 retracement levels. But right now we are sitting on the .786 retracement level and we are sitting near trendline support.
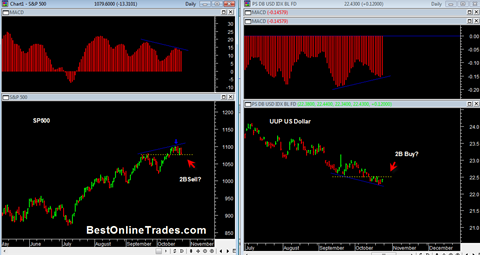
But the bigger story is the near term story in which we see a bullish divergence in the UUP ETF US Dollar Index and a bearish divergence in the SP500. The divergences exist between price and MACD. There have been divergences in the past on both markets and they have not led to persistent price moves. Rather they have led to reactionary price moves and then resumption of trend.
However there is a lot of evidence that suggests the bearish and bullish divergences will be more sustained this time instead of just reactionary. I won’t go into that now but instead just revert to the nearer term bullish bearish divergence chart in the SP500 and UUP ETF.
This is about as clear a divergence setup as I have ever seen. I am going to be extremely surprised if this last week of October is a UP week. I have been surprised many times before, but odds to me say this chart depicts hard down during the last week of October.
In addition to the bearish and bullish divergences in the SP500 and UUP ETF there exists the possibility of a 2B sell signal initiating in the SP500 and a 2B buy signal initiating in the UUP ETF. The 2B sell and buy signals would initiate after price moves either above or below the yellow dotted lines in the chart above.
The EURO is also showing a bearish divergence similar to the SP500 bearish divergence which supports the case of a bull move in the US dollar.
Hold onto your hats during the last week of October! These charts are saying we are going to get a ‘Halloween scare’.


