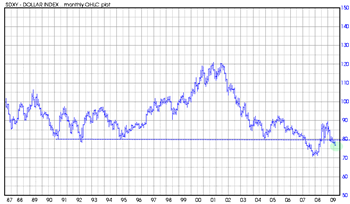
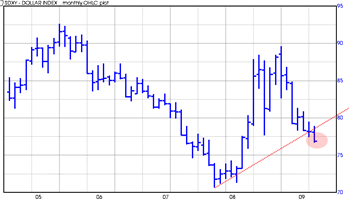
If you have been wondering why gold and the broad market is powering higher take a look at these two charts of the US Dollar Index. The US Dollar Index has broken key levels of support on both the longer term and shorter term price charts.
On the longer term chart going all the way back to 1987 you can see clearly that the US Dollar Index has broken below the 79 level and it now opens the door to the 70 to 72 level in my opinion.
The nature of the decline in the US Dollar index over the next few months is going to be key in determining how far and fast the gold price moves up and also how orderly and sustained any further broad market advance becomes.
If the US Dollar decline turns into an outright panic then it could start to cause problems for the broad market and give gold an extra boost.
These charts are hinting that the broad market advance is not over yet and could still be sustained for quite some time and go farther than most believe. This is why I think it is a bad idea trying to pick a top every other day.
Better to focus on the trend of the Dollar and see if that can help cue us in on possible future turning points.
There is not hat much support at the 70 to 71 range but I would still expect some kind of big bounce up from there… Is it possible that the 71 level in the US dollar index will be where we start our first major downside correction in the stock market and gold as well? It’s possible, assuming we even get to those levels.


