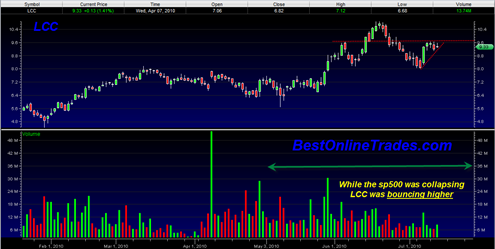
US Airways Group LCC since end of April and since the May 6, 2010 flash crash is trading much higher than the regular stock market. It has managed to trade a lot stronger than the rest of the market and show lots of relative strength.
Now that the regular stock market is starting its own recovery I would expect LCC to continue to lead the way on a break to new 52 week highs. LCC could very well be the leading bull in the stable.
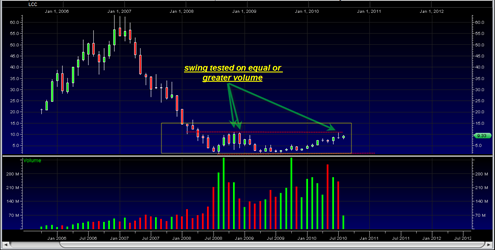
The longer term chart of LCC looks equally bullish on both a structural and volume basis. The near term chart of US Airways Group, Inc. shows that LCC appears to be creating a head and shoulders topping pattern. I suspect that this head and shoulders topping pattern will fail and that LCC will be able to break above the 9.65 swing point possibly leading to another strong move.
Some airline stocks have been very strong. The stocks that were strong during the last two months correction are the best ones to pick when the market moves out of its corrective phase as they are often the lead sled dogs.
The last time I was at my local airport (a few weeks ago) I can tell you that it was absolutely packed. We are in peak travel season right now and people are flying all over the place and in a travelling mood. And the airlines seem to be taking full advantage of them with all kinds of extra fees and charges and raking in the cold hard cash.
If US Airways Group, Inc. is able to break above 11.24 in the months ahead it will likely be initiating a major longer term bullish move suitable for position type trading.


