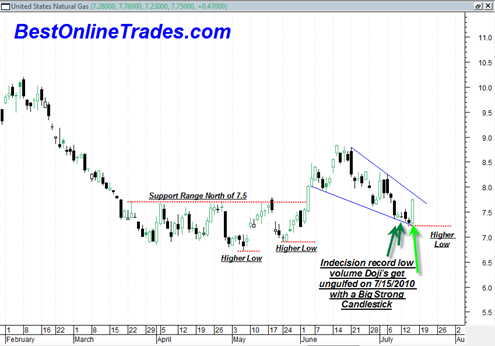
The United States Natural Gas Fund LP or UNG is building a falling wedge formation which appears to be a small part of a very large overall process of a new major building uptrend.
I did a post here at Best Online Trades way back on June 3rd 2010 on the long term natural gas futures chart where I indicated that natural gas is probably in the early phases of a new bull market trend.
Since that time natural gas and the United States Natural Gas Fund LP UNG ETF has traded higher but it has been in a choppy form and has been reluctant to show significant ease of movement to the upside. This is normal and probably is to be expected in the early part of an uptrend. Given the total collapse that occurred in both natural gas and the UNG ETF between July 2008 and September 2009 (roughly an 80% crushing bear market decline) it is perfectly normal to see the UNG take its time to build a new foundation for an uptrend.
As stated earlier, the daily chart of UNG shows that it has been building a falling wedge of roughly one month in duration. It recently broke through the 7.7 range of support but today was significant because price snapped right back up to the top range of support.
Not only that but today’s big wide price spread candle on big volume engulfed the last 4 narrow range day candlesticks, two of which were dojis. This is a bullish sign and a signal that this wedge may be nearing completion.
Also significant is the 7/12/2010 candlestick print on the UNG ETF which was a record low volume day for this ETF since very early 2009. A record low volume print like that would be very concerning to me if this ETF was trading higher after a tired uptrend. But the exact opposite can be said in this case (The UNG is testing bear market lows and only slightly breaking under recent support). So this low volume is telling me there exists selling exhaustion or weakness at the bottom of this falling wedge.
Also noted on the chart is the series of higher lows, another bullish sign for a potential new upside breakout trend in the UNG ETF. Again, the early part of any uptrend is going to be choppy and cumbersome.
We are moving in an interesting seasonal time frame for natural gas futures as well. According to both the 10 year and 17 year seasonal chart of natural gas futures we see that the full months of September and October are the two strongest months for this commodity. So roughly 1.5 months from now we are in the strong seasonal time frame.
Chart source: Spectrum Commodities
I like this falling wedge pivot and will be looking to go long for a while on a breakout from the pattern. I am thinking this could have potential at making it to the 10 to 11 range by end of October if the seasonals kick in and the trend gains some strength. That may be too optimistic but it is going to be interesting to see how the UNG reacts out of this pattern.
The daily histogram is also confirming a buy signal today.
Usually after a big up day like today there is some type of retracement. The action next week may reveal some better clues. But right now I like the setup and the large pattern and the seasonals for the next 3 months. This may be a better setup and either gold or the broad market or most everything else for that matter…

