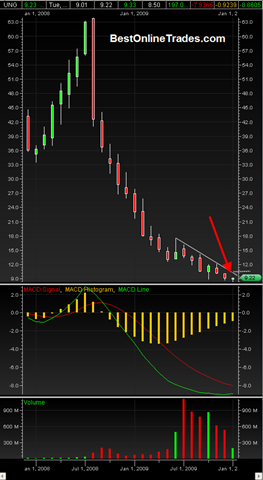
The UNG Natural Gas ETF long term monthly candlestick chart looks good for a possible real longer term reversal starting in January 2010.
The current monthly candlestick on the UNG ETF is shaping up to be a bottoming tail and I think it is a good idea to keep an eye on that monthly candle as December 2009 comes to an end.
I don’t think the UNG ETF will be able to break above the down trend line resistance significantly until January 2010, but whether it does it in December 2009 or January 2010 is irrelevant at this point. If it achieves that then it is signaling a possible major trend reversal and possible extended new uptrend. I am viewing 10.20 and higher as a key level to sustain
The monthly MACD continues to slow in bearish momentum and I suspect it will be ready for a bullish cross going into January 2010.
So the UNG ETF could very well be an outstanding core type trade within this key time frame. The daily chart has down that the UNG is forming a more complex double bottom formation. I suspect that the UNG will continue to play lots of head games down in this range until it gets enough of a launch pad to get the new uptrend going.
This is definitely a slow cumbersome process but I believe a 2010 trend change of some sort is at hand.

