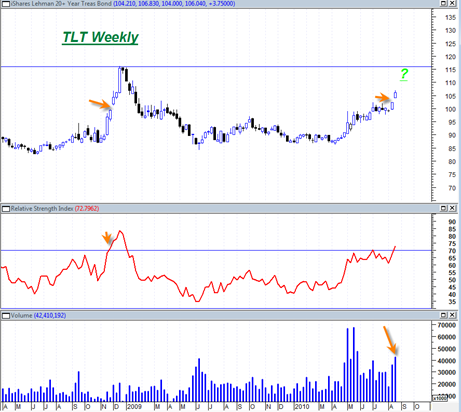
I wanted bring up the TLT chart quickly again just to make a quick point. I mentioned before about how the TLT ETF moved into the power zone above the 70 level last week and that this could correlate with a very hard down move in the stock market.
Anytime any stock or index gets above the 70 powerzone level on the Relative strength Index there is always the risk that it either tops out or extends its breakout into a blow off type run.
The weekly chart of the TLT ETF I think is the most important as it shows a very important chart aspect, a WEEKLY opening gap. The Japanese candlestick charting techniques view opening gaps as ‘windows’ which can sometimes serve as the start of a big move.
The weekly chart of the TLT above clearly shows that WEEKLY opening gaps are not very common. We are in the power zone above 70 on the weekly RSI and it would seem that we have another 1 to 3 weeks of higher TLT prices which could correlate with a massive plunge in the stock market . . .


Tom
Thanks your analysis / post. Interesting points. I am not a technician, but the whole of today (Monday 23-Aug) seemed subtle but I would guess very discouraging for the bullish case for the stock market overall. I “sense” this market is very dangerous.
I agree with you 🙂 I hope the bears really take control this week for a change with some real conviction.