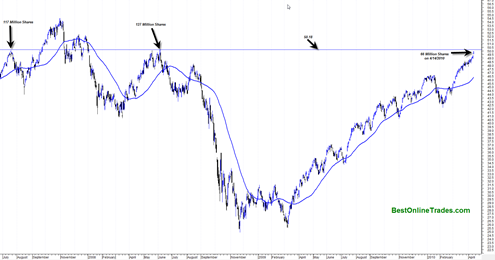
I just loaded up a longer term chart of the QQQQ Nasdaq tracking ETF (PowerShares QQQ Trust, Series 1) and I found a couple of potentially important clues. The clue has to do with the current level the QQQQ is at right now and where it is situated relative to two other very important peaks. It also has to do with the volume level at those peaks and the current volume at present day.
Nine times out of ten (my own approximation) whenever you have a stock or index reach a previous key peak level in the market, there is usually some type of retracement for the simple reason that previous holders want to get their money back. Another reason is because technicians are also watching these levels and use it as an excuse to sell. And a final reason is the quality of the volume test because in volume analysis you need volume that is within 3% or greater of the previous highs volume for there to be an eventual successful breakout from that level.
The chart of the QQQQ as shown below indicates that it is only .54% away from testing a very key previous resistance level both in terms of price and volume.
Basically we are within ‘inches’ of this key level. The key level on the QQQQ is 50.18. This is a key level because you can see from the chart the two previous key price peaks were generated at this level and they were relatively sharp peaks.
More importantly the volume indicated on the previous two peaks was 117 million shares and 127 million shares. Pretty heavy volume.
The concern is that on today’s ‘wonder rally’ on the QQQQ PowerShares QQQ Trust, Series 1 we only did a lousy 66.7 million shares. This is 43 to 47% LESS than those two previous price and volume high peaks as shown on the chart.
Why is This Important?
It is important because volume is the demand and the energy that moves price and when you see weak and feeble volume on an approach of two previous important price peaks with much higher volume, it is an excuse enough for price to pull back sharply.
Even if the current volume was very strong, there would still be a very high probability of some type of pullback for the simple reason that we are hitting these price peaks.
So combined with today’s RECORD daily RSI reading on the QQQQ of 81.01, and the fact that we are feebly pushing towards these two previous price peaks tells me that at the very minimum we should pull back a little bit or even trade sideways to work off some of this overbought condition.
I suspect that since we are only half a percent away from this level what you will likely see is a strong rally tomorrow, a test of the 50.18 level, and then an intraday reversal and bad close.
It will be very interesting to see what the total volume number is tomorrow for the QQQQ. And if the QQQQ is able to get high enough to test the 50.18.
Watch for the price reaction at that level by 2pm to 4pm on 4/15/2010.
I can almost see the headline right now before it even happens. The morning headlines will probably be something like, “Unstoppable rally continues”, but then the end of day headlines may be, “Investors sell stocks to pay their taxes on tax day”.
Tomorrow could be a very key day in the market.

