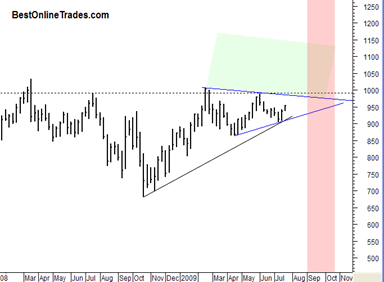
There is in my opinion a blockbuster trade developing in the gold market right now. It is one of those slow motion type developments that usually catches people off guard.
This has the potential to be a very big trade in my opinion.
The chart to the left is a simple representation of what I am talking about. I will go into more detail on this in future posts. You can click on the chart to the left to see it full size. The trade developing is a combination of a symmetrical triangle pattern in the gold price in addition to very bullish seasonals coming in September 2009. The red shaded area represents the very bullish seasonal time frame for the gold price. The green shaded area represents break out territory of the gold price from this several month congestion area also represented as a somewhat large symmetrical triangle pattern.
So far since the November Lows the gold price has been able to maintain a bullish posture above this longer term up trendline. It has touched it three times so far and continues to behave well.
I am going to follow up with more details on this in a future post but for now I am going to go ahead and put the DGP ETF which is the double gold long ETF on the BestOnlineTrades recommended list with a buy stop at 22.50.
| BestOnlineTrades Recommended List | Symbol | Date of Rec. | Entry | Stop | Buy Stop |
| UNG | 7/22/09 | 13.88 | 12.90 | ||
| FITB* | 7/22/09 | 7.60 | |||
| CEMJQ* | 7/22/09 | .275 | |||
| DGP* | 7/22/09 | 22.50 | |||
| *pending |

