The last several days in the tape action of USA stock markets have been nothing short of extraordinary.
The USA Stock market has used a medium time frame bullish divergence in price versus RSI and MACD histogram to generate a persistent rally higher. This rally is likely to remain persistent in the weeks ahead from what I can see so far. It looks pretty clear to me that this bear leg is done and that the market is now likely to embark on a challenge of the highs again.
I am pretty confident that oil (USO ETF) has bottomed and the ERX (Energy Triple ETF) as well. It looks like gold and silver have done the same and the UUP US dollar index has topped for now. That should also mean that the Euro FXE ETF has bottomed as well. This is quite a bit to chew on, and it remains to be seen if I am correct, but this appears how it is all shaping up. Everything I just said in this paragraph pretty much needs to happen in sync because of the contrasting relationships between them (ie. US Dollar Index and Euro… and US Dollar Index and gold and stock market).
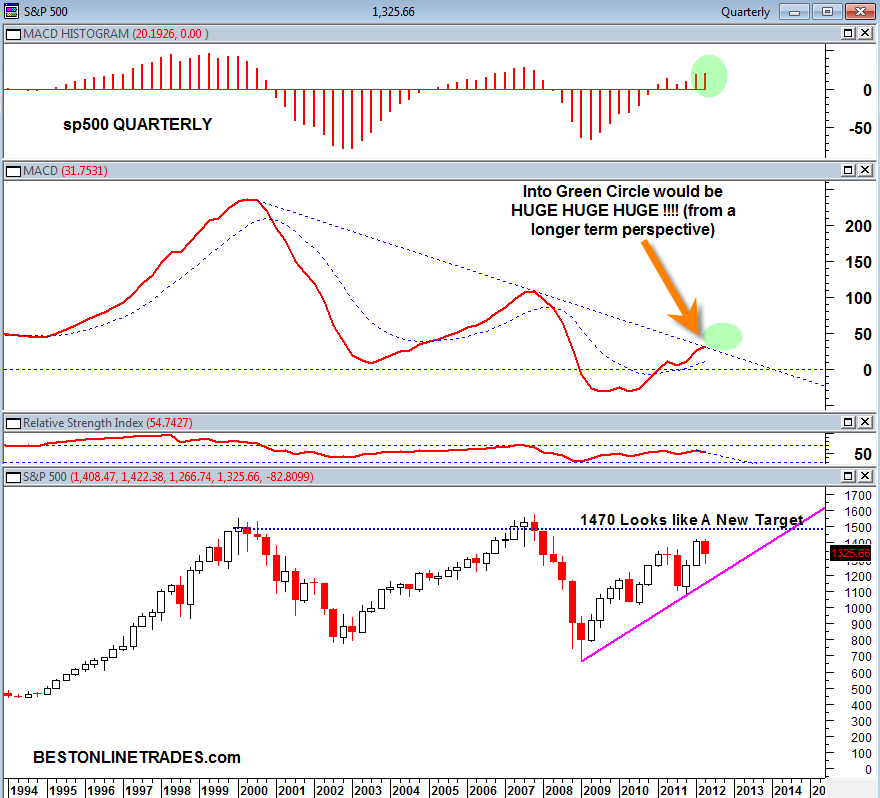
The Quarterly MACD on the USA stock markets has re morphed itself into a bullish stance and this is a very important development at this juncture because we are about to transition into the end of the 2nd quarter which means a new quarterly price candlestick will print next month. This new price candlestick will affect the longer term bull bear indicators.
When I say the Quarterly MACD has morphed into a bullish stance, I mean that there exists a very long down trend line on the quarterly MACD indicator (starting from the year 2000) that looks like it is about to do something very important. If we continue higher in the USA stock markets into the end of this month as I currently expect, then it puts the market in a position to continue forward momentum into the following quarter. That would likely cause the quarterly MACD to bust north from this 12 year down trend line !!!!

I recommend that all technicians worldwide study the above chart very carefully because it suggests to me we have a potential giant awakening here. The cloud of bearish news is extremely thick in the current environment, but one has to make a clear analysis from what price itself is telling us.
Sometimes individual stocks can be a ‘tell’ for the inner workings of a market and longer term prospects.
Perhaps you may not have noticed, but I suggest you take a good long look at WMT (Walmart) and its 20 year chart on the monthly or quarterly scale.
Walmart is breaking north from a sideways 12 year sideways base! This is an absolutely huge development 12 years in the making!
Looking at the chart of Walmart tends to open one’s mind to more bullish possiblities for the USA stock markets. 1470 looks like the next longer term directional target for the sp500. Assuming that is achieved, then 1600 remains the next longer term most optimistic target from a longer term perspective. 1600 represents huge potential resistance and could serve as an enormous turning point, or new breakout point.
But first things first. This market needs to show that it can resume the highs again. There is a lot that needs to happen between now and that point if it is to arrive. One step at a time…
P.S. Remember that the Quarterly trend is really the ‘super tanker’ trend that defines massive long term bulls or bear markets. It is a fact that right now this trend is still in positive oscillation as shown from the MACD indicator. A persistent longer term hyper bearish trend really cannot occur unless we have the quarterly MACD in a negative crossover stance. So I would be very weary of forecasts or analysis from others who proclaim end of the world collapse scenarios from this juncture forward because of Europe problems or similar.
