The SPY ETF from March 9, 2011 to March 16, 2011 has done a swift move down in somewhat vertical fashion. The recent two trading days has shown the SPY trying to get a bounce going, but so far I would describe the bounce as somewhat lackluster. Sometimes real upside bounces take more preparation before they really show their true colors. So far the SPY has not been able to manage much or a bounce relative to the swift decline into 3/16.
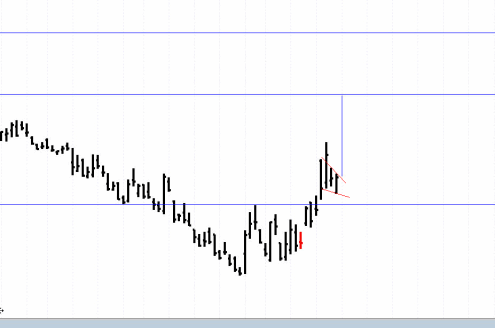
If we flip the chart of the SPY ETF upside down we see that the SPY looks like it has made a swift almost vertical move up and then consolidated with a slight downward slant. This downward slant almost seems to take the shape of a high tight flag formation which is a potentially powerful bullish formation. But since the chart below is the inverse chart of the real SPY chart the implications should be the exact opposite.
High tight flags show a short and crisp consolidation pattern after an almost straight line move up. Then, typically they are followed by a follow on move that tends to be about the same distance as the ‘mast of the flag’.
Looking at the upside down SPY chart above looks quite clearly like a bullish behaving stock. A huge surge above resistance with a sign of strength on huge volume. Then, a high tight flag consolidation with a slight downward slant.
If this pattern plays out then one would expect a move to the middle horizontal blue line which would put the market roughly at 1220 on the sp500.
The one thing that is missing from the chart above is a true back test of the lowest horizontal solid blue line. This would be a typically Wyckoff retest but we have not seen the market fully retrace to this level. It could still happen early this week, but I would look for a test and then a strong reversal off of this line as confirmation that the bear is still alive. . .

