The beauty of technical analysis of the sp500 is that it need not be excessively complicated.
Simple is great especially when it comes to the stock market timing. Simple is usually what makes the most sense.
In the long term time frame the simple argument is that we are topping in a major head and shoulders pattern based on several important indicators.
In the short term the simple argument is that we are currently trading in a rectangle formation that is a continuation pattern and that price will resolve to the downside very soon, as early as next week.
It is starting to look like we will get a negative close for the market and this would set up a very bearish week next week which would validate my longer term bearish forecast.
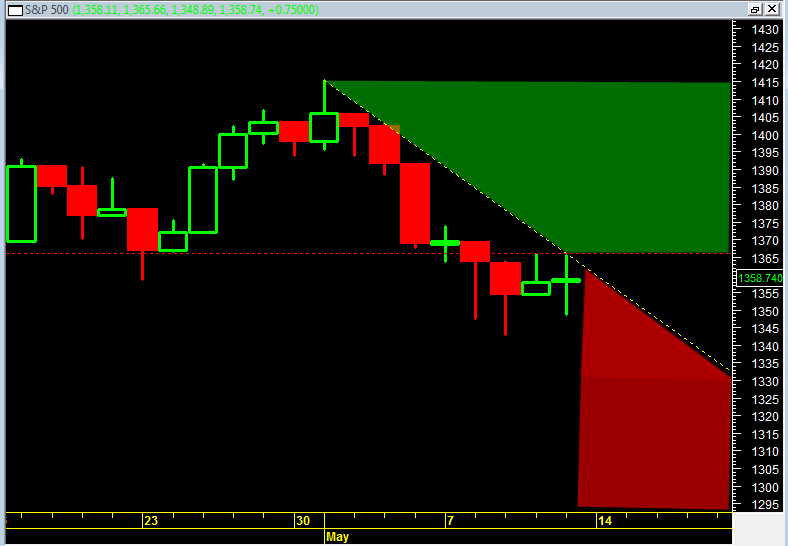
The simple bearish argument for the near term can be summed up in this chart:
The chart of the sp500 above shows that the green shaded area is the bullish zone break up and recovery area. The red shaded area is a bearish break down area which I believe will occur next week.
The yellow dotted line that starts up at the top near 1415 is a down trend line that meets todays HIGH PRICE. Thus we can presume that this downward force will stay intact and cause prices to resume downward again next week.
Further, the red horizontal dotted line represents new recent resistance and so far the market has shown that it is unable to recover back above this line. Thus we are to presume bearishness.
If the current market weakness holds into the close (about 1+hour) then I have to tip my hat for significant bearishness in the tape next week.
But ultimately regardless of my opinion, the chart above shows the very clear and precise battle lines that are drawn for the sp500. It shows that the sp500 must not make a higher high early next week. To keep bearishness we should witness prices early next week in sp500 that are at or below 1360. We must see 1360 as the max high early next week to keep bearishness intact.

