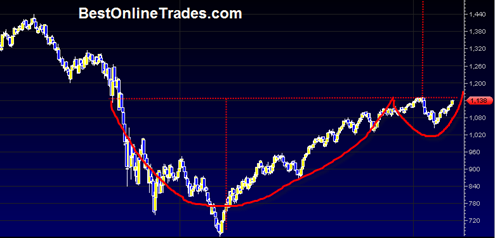
 The SP500 has elected to break above the crucial 1116.56 level that I had alluded to several times before. This is a very bullish development and now opens the door to expanding upside price action moving forward into 2010.
I cannot recommend shorting this market now. The risk reward is simply not there. That is not to say there will not be some chances to short some swings in the future, but as far as strategy is concerned I believe a mostly long only strategy is the most appropriate at this point. More specifically a long only small cap strategy.
We recently saw the Russell 2000 small cap index hit a new 52 week high, a bullish sign and showing that the small caps are leading the continued ongoing recovery. I expect the SP500 to follow suit going forward.
At this point I believe the deflationary scenario so widely talked about is dead. The market was not even able to get to the 1000 level on the sp500 so once again I have to read into the tea leaves and respect what the market is telling me. It is telling me there is still internal strength, and an upward bias. The Armageddon scenarios just do not hold any more water. And to be frank, the only time I will next consider an Armageddon scenario and start to short aggressively again is when the 20 week moving average crosses below the 50 week moving average and price shows a weak stance after that configuration. Even the XLF is starting to look bullish! After a long sideways consolidation it may soon get a northward breakout going which is very important because it has built a substantial amount of sideways cause for quite some time now.
Be Bullish and Look for Bullish Opportunities
Now I want you to consider this chart of the SP500. But before you do that, take a look at the previous post I did on the Shanghai Composite index. In that post I point out the possibly huge implications a bullish breakout north out of the large head and shoulders bottoming pattern would imply. Put simply, it would imply much much higher prices for the Shanghai Composite in the year(s) to come.
But now, when looking at the SP500, I cannot help but think there exists a similar and potentially just as powerful longer term pattern developing.
A massive cup and handle pattern on the SP500 ? It is definitely a possibility, and given the size of this overall pattern could imply, similar to the Shanghai Composite index, a move near the previous all time highs (1500 SP500).
Of course this is a much longer term chart and first the SP500 must get above 1150 and get a retest going and then power higher. It seems almost absurd to think that the SP500 could actually get back up near its old all time highs again… but wait, this is actually a possibility and one of my original scenarios I have been considering quite some time ago.
It would be consistent with the nature of the very large swing trading range we have been in since the year 2000.

