The Gold Price is not inspiring that much confidence right now. The US Dollar Index got a huge breakout going and gold seems to be shying away from the recent range.
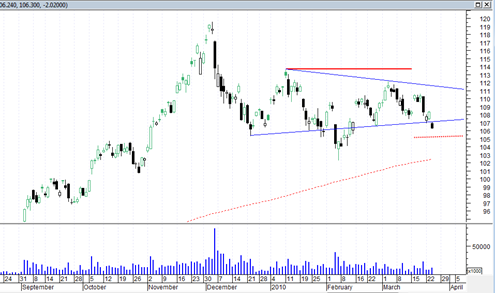
I indicated in my previous post on gold that a move above 114 was critical for me to start jumping up and down and get on the gold train again. Otherwise there would be risk of bouncing around in a tiring dangerous trading range. That appears to be the case now and it is important for the GLD ETF to hold 105 level as it would help to create a clean looking head and shoulders bottom formation.
If it breaks the 105 then there is a risk that the GLD wants to continue to break down in a confirmed A-B-C down taking us to perhaps the 100 level.
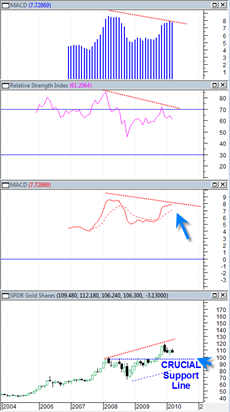
 I also just reviewed the weekly and monthly charts on the GLD and it seems like the GLD is at a very critical level right here on the longer term charts. On the weekly charts the RSI (14 day) has just done a double bottom at the 50 level.
It would not be good to see the weekly RSI start breaking below the 50 level now. It could imply further weakness in the weeks or months ahead.
The monthly chart also looks potentially very bearish as there is a very large bearish divergence between the monthly RSI and the monthly price between 2008 and 2010. Also, the monthly MACD appears close to giving a major bear market signal and also a bearish divergence between 2008 price and 2010 price.
These are new developments I am seeing right now. And it is almost a complete 180 degree turn in my view since my last post. But I have to make the call as I see it and change my opinion on the short term, intermediate term or long term basis as appropriate.
I am not at the point of saying the ‘gold bull is over for about 2 or 3 years’ but the way these charts are staring at me right now I am pretty close to that point. Be very careful in this market from the long side now. We may be at a very crucial turning point juncture right here.
Gold has been moving up almost in a straight line since 2001 on the longer term charts and so from a technical cause standpoint is more at risk of a longer term intermediate breakdown than many other securities.
Take a look at the super long term YEARLY chart of the gold price on bigcharts. Note on this chart that the 2009 large yearly candlestick is showing a very large topping tail which is an indication of a large amount of SUPPLY coming into this market. It is a concerning sign as we move into 2010. The 2010 yearly candlestick so far is an indecision doji but obviously is still developing. If it continues to develop in the down direction then it will once again show another topping tail and a sign of more supply that entered the market. That would be two yearly topping tails showing supply in the market.
All these signs are telling me the top is in for the gold market for 1 to 3 years. BUT, I could be completely wrong, and the condition that will determine if I am correct of incorrect is a very solid holding (or lack of ) of the 100 level support on the GLD ETF.

