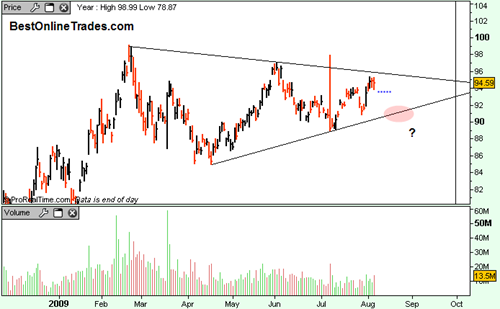
GLD ETF Meandering inside a Triangle

gld20090807

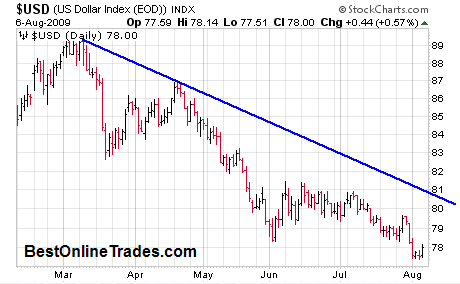
You probably just read my previous post on the US Dollar index where I talked about how the dollar really needs to stay below that funny blue looking line to keep it in a near term bear trend. 

But now we are looking at the GLD ETF which is in a sideways triangle.  Triangles can be a real pain because volume gets really light as price compresses into the triangle.  I am starting to think that the GLD ETF is going to make another trip to the bottom boundary of this triangle near the red shaded circle on the chart.

Read more

Keep an eye on The US Dollar Bounce

usdollar20090807

The US dollar has an upward bounce going today.  The chart above does not show today’s price move but it is near 79 right now.  It is no surprise that gold is taking a bit of a hit today. So now what?

First, before I even get into the meat of what I want to say I should tell you that there is always a bull side and a bear side to every trade, no matter what the time frame is.  There are always levels that if achieved, or if broken, can dramatically change what the outlook is. I am telling you this because there have been times when I have become extremely bullish on something, but then things started changing and key levels were broken, and I had to change my stance immediately. 

So why this talk about bull and bear side?

Read more

EPEX Edge Petroleum coming close to a Decision Point

epex20090806

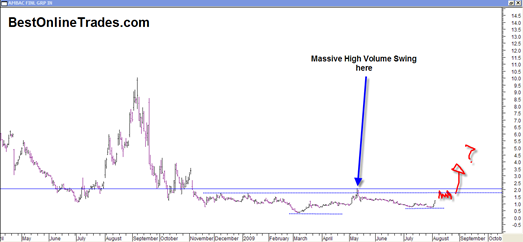
This is an important alert on EPEX.  I did a post before on EPEX Edge Petroleum.  You can see the previous post under the related posts section down below.  It looks to me now that EPEX is coming close to a decision point and I cannot say for sure whether it will be up or down but the probabilities say it is going to be an upside breakout.

There are two significant swings on EPEX that make this analysis worthy.  You can see them more clearly if you click on the chart above.  They stand out like a sore thumb.  But the key point to be made about those two price swings is that the second one had volume that was substantially larger than the first one.  That is an important clue about what the future direction of the stock price will be upon a breakout from this pattern.

My analysis shows that the direction will be UP.  However we will not really know until it happens… that is just the way these markets work, let them give you the signal and then go with the flow.  As of now EPEX is still constrained within this tight range.

Read more

It is time to put ABK Ambac Financial on the Radar Again

abk20090806

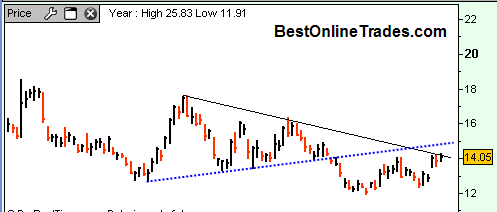
ABK Ambac Financial also came up in my new scan that I developed yesterday and also showed up in the MarketClub Scan.  As I just indicated in my previous post, the real estate sector is starting to rise from the dead a little bit and so this sector may be worth paying attention to.

I was lucky enough to play ABK Ambac Financial way back in August of 2008 after it had a massive bear market rally from a dollar and change to almost 10 dollars.  I remember it vividly because I was on vacation in Cape Cod up at the Eastham cottages and I remember trying to manage this trade with my laptop using the hotels wireless connection they had in the lobby.  I would go there every morning and then in the afternoons trying to engineer the Ambac trade.  At the time it was consolidating in mid August (see chart full size by clicking on it above) in a somewhat ascending triangle or symmetrical triangle pattern.  But I was stopped out several times and then had to re enter for the eventual move to 9 and change.  I had to be real careful about getting into Ambac because the stock had already had a big move and I was not in the trade right off the bottom, so I was unsure whether it had enough steam to go higher.

Read more

UNG Natural Gas ETF starting to look more and more bullish

ung20090805

On a risk to reward basis which is the better trade? The gold trade or the natural gas trade?  I think they are close to equal ground, but the more I think about the more I think that the UNG ETF Natural Gas trade is the one that has more merit in terms of maximum risk reward.

But let me be clear, the UNG ETF potential move is still a much different animal than the gold market.  I don’t think it can be said that natural gas is in a long term bull market.  It is an entirely different animal.  But nevertheless it has had a massive bear market crushing decline and now looks like it wants to get started on the ‘busted pattern’ setup that I had mentioned a couple times before.

Read more

Gold Stock GSS Golden Star Resources Setting up for a Breakout

gss20090805

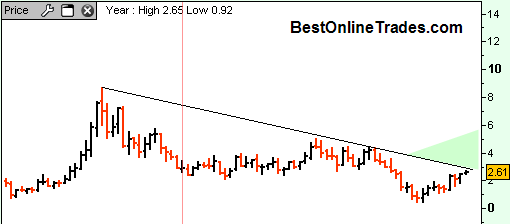
GSS Golden Star Resources may be setting up for a breakout soon.  Amazingly GSS has been in a consolidation since December 2003 !  I don’t know about you but that is a LONG time in both regular time and trading time!  GSS is now slowly approaching its long term down trendline and I think it has got a good shot at getting some sort of breakout going.

I believe earnings are coming out on August 11th.  Not sure if that is going to be the catalyst or not, it could be.  So far GSS has touched its long term down trendline 3 times previously, so this resistance line is definitely significant.

When you combine this price structure with my previous alert on the gold price, you have the makings of a high probability trade.

Read more

Three Important Charts S&P500 Nasdaq Composite and the QQQQ’s

sp50020090805

I have three important charts to share with you that could help to clarify where we are and where we might be going.   These charts are pretty much self explanatory but I still believe they illustrate important points or guideposts if you will for future market action. The first is the S&P500.

You probably know already what I am going to say with respect to this chart.  It is the monthly chart and it shows the powerful move up in July and now the follow through bar for August.  Clearly the August bar is just beginning but you can see we seem to be on a mission to the down trendline of the bear market that started in late 2007.  Now before I say anything more about the S&P500, lets look at the other two charts first.

Read more

What would cause the Gold Price to go Truly Parabolic ?

usd20090805

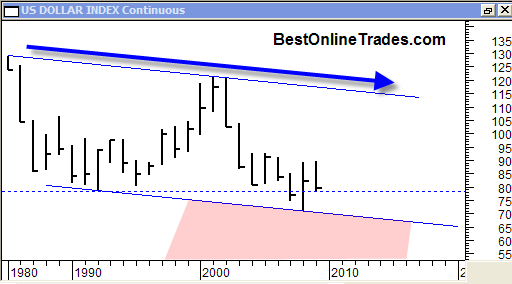
Have you ever thought what might cause the gold price to go truly parabolic (aka vertical) ?  It seems that the personality of the gold price is one of parabolic structure.  That was the case in the 70’s and so I see no reason to believe this will not be the case now.  It probably will.

The chart above is the US Dollar Index chart plotted with YEARLY price bars.  It should be quite clear that this is a very long term price chart since it takes a whole year just to complete one price bar !

Read more

Quick Follow up on US Steel X

US Steel was up almost 9% today after my mention of it this past weekend.  I talked about how it appears to have a large head and shoulders bottoming formation.  Today’s action makes it look like the breakout from this pattern is in force.

The volume was very robust today especially for the first Monday in August.  This large head and shoulders bottoming formation has some rough targets. 

I calculate about 20 points between the low of the head portion of the pattern and the neckline of the pattern.  So the minimum measurement rule here suggests that US Steel could get to about 60.  Assuming this is the real breakout this week, then one thing to watch for is the retracement back to the neckline.  That may serve as a second opportunity to ride this new uptrend.

The size of this pattern is significant in that it is almost 1 full year long.  That is a lot of cause for a sustained move.  Head and shoulders bottoming patterns tend to be quite reliable in my experience.  They are not perfect patterns, but they do tend to give very reliable signals.

It should come as no surprises that US Steel got this move going in light of the fact that the US Dollar Index has broken down again in the most recent two days.  I talked about the US Dollar Index several other times and have said repeatedly that it is at a crucial juncture and at critical support.  Now it has elected to break that critical support.

Read more