SP500 about to get a Bullish Monthly MACD Buy Signal

sp50020090811

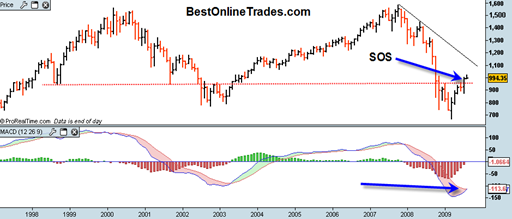
The SP500 is about to get a bullish monthly crossover on the MACD indicator, a popular moving average combination indicator that can become very useful over longer time frames.  The monthly MACD signals can signify new major bull or bear market moves with sometimes 1 year or more duration.

The current daily MACD signal is starting to flash some near term sell signals and could set us up for a move to test the 940-945 range on the SP500. 

It is confusing sometimes when you have a sell signal on one time frame and a buy signal on a different time frame.  To help clear the confusion, I always keep in mind that the longer term time frames have precedence over the shorter ones.  So while we could get some selling pressure into 940-945, we must remember that the longer term signal is indicating higher prices.

Read more

The Gold Market Battle Continues

gld20090811

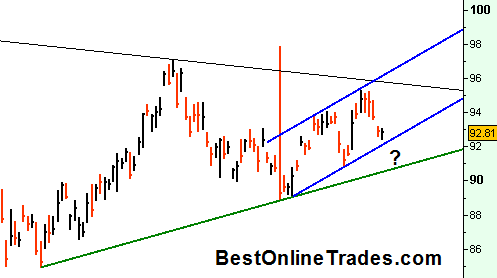
The GLD today barely did anything but is still inside this blue trending channel which I talked about previously being important for a ‘breakout by September 10th’ scenario.  The volume today was really light on the GLD and it looks to me like the success or failure of the retest of the bottom of the blue channel line could occur tomorrow.

If we break under the blue channel line then it is going to open the door to another retest of the bottom of the symmetrical triangle (the green line).  If that happens it will be critical to hold the bottom of that triangle for an eventual breakout later in September or the final quarter of this year.

I would like to see the US Dollar break down tomorrow and see gold jump right back topside to make another attack on the top portion of the triangle.  But what I wish for and what happens are two entirely different things.  The US Dollar still looks like it wants to pop to the upside as a resolution to its bullish divergence.  But maybe something out of tomorrows FOMC will change that outcome? 

Read more

ANDS Anady’s Pharmaceuticals Possible Breakout Setup

ands20090811

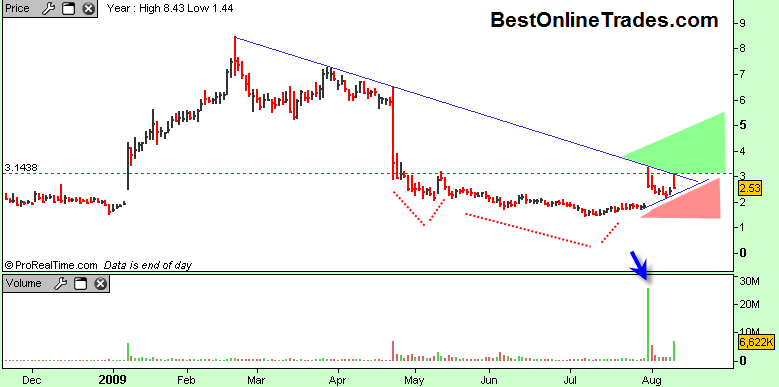
ANDS has had a couple recent big price moves to the upside, and the overall price structure is suggesting to me that ANDS could be setting up for a breakout.

After a brief strong run in the beginning of this year, ANDS went into a somewhat relentless decline to roughly 1.50.  It then had a pop up to the 3.00 range on blockbuster volume.  That pop was sold off intra day and today’s upside pop was also sold off intra day.  However the overall structure of ANDS has some notable and constructive aspects to it.

Although somewhat messy looking there appears to be a head and shoulders bottom formation with neckline resistance at 3.14.  The left shoulder was around 1st May, the head from mid May to end of July and the right shoulder the last 6 trading days.  If I am correct in identifying this head and shoulders bottom, then we could eventually see 4.50 as a target.

Read more

ERPLQ Energy Partners Limited may Breakout Soon

The market is taking a slight beating today but EPLRQ, a somewhat spotty and thin trade penny stock has a pretty decent pattern and may get a run going if it manages to consistently trade above .45. It pattern looks somewhat like a head and shoulders bottom formation with the right shoulder being much longer … Read more

Gold Needs to get Moving and Soon

gld20090810

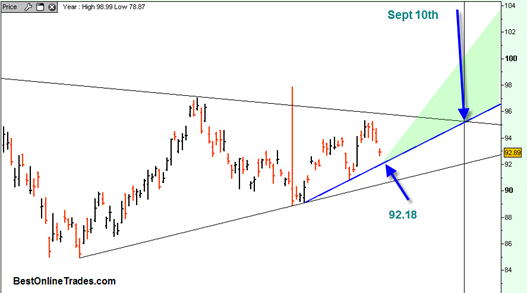
If the gold price is going to get a breakout going out of this large symmetrical triangle into the typically strong seasonal time period of mid-September, then it needs to hold above the blue trendline drawn above.  It needs to remain above this blue trendline for the next month or so if an accelerated breakout scenario is to take place.

It would be an ideal situation for a breakout out of this symmetrical triangle because going too much further into the apex of the triangle could possible weaken any potential breakout.

I have labeled minor support along that blue up trendline as 92.18 on the chart of the GLD ETF above.  I would expect at least a one day bounce after touching that line.  A break under it would invalidate the near term breakout scenario and open the door to a move back down to the bottom portion of the triangle.

Read more

The Most Powerful Cycle Model Ever Created

In case you do not know about it yet, I would like to tell you about what I believe to be the most powerful cycle model ever created.  I did not create it.  It was created by a man named Marty Armstrong who headed the former Princeton Economics Institute which was an institutional advisory and money management firm.  PEI as it was known has since been shut down by the United States government for reasons I can’t speak to because I don’t know the details or facts about them.  But I will say that it is a crying shame that their business and knowledge was shut down because it was in my opinion some of the most valuable and important financial knowledge ever devised.

The former website itself used to have unbelievable amounts of historical research on money and financial panics going back hundreds and even thousands of years.  The only reason I know about it is through a radio program that used to play in California and was hosted by Buzz Schwartz, a trader and radio host.  He used to have Marty on as a guest and I listened to their interviews and his advice on markets.  I also got a few of Marty’s monthly ‘Capital Market Review’ publications and that is how I am able to tell you about his cycle model.

Read more

StockTwits is a Great App for Traders

stocktwits

In case you do not know about it yet, you should really check out Stocktwits.  It is a great app for traders and connected to the twitter platform.

The reason why it is great is because it can be a good source of new trading ideas.  Basically all you have to do is go to the main site and watch new posts as they scroll down occasionally and automatically.  When you put your mouse pointer over the stock symbols at the end of each post a nice candlestick chart immediately pops up so you can judge instantly whether something interesting is going on or not. 

The nice thing about stocktwits is that you are looking at stocks that are the result of someone else’s analysis.  So there was some judgment involved in putting it there in the first place.  The caveat is that we have no idea how much experience or skill the person has who posted the symbol or chart and we have no clue whether they are more technical type traders or fundamental type traders.  Regardless, it can be a possible source of new trading ideas when either your scans are coming up dry or you cannot find good setups elsewhere.

Read more

Stock Scanner Results for August 7, 2009 AWBC and VOCL

awbc20090807 vocl20090807

Only a small handful of stocks came up on my new scan that I discovered.  I got 6 results from over 4500 NYSE and Nasdaq stocks. Unbelievable.  I continue to be extremely impressed with this scan because it is returning so few candidates out of so many thousands of stocks.  And some of the candidates it returns tend to be at optimal time and price locations.  Now part of this is the result of the positive overall structure of the broad market, or is it?  I will not really know until I start to see the results of this scan in a more choppy sideways market or bear market.

The stock scanner also tends to reveal a lot of spotty type stocks.  With more spotty volume and price.  That is because I have it open to give me results on as many stocks as possible.  I am not limiting it to stocks that just trade above a million shares a day for example.  I do this because I do not want to limit opportunities of what it may find.

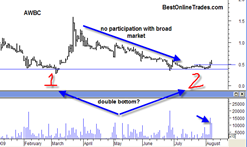
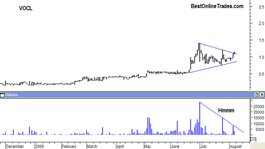
Anyway, AWBC and VOCL came up in the scan.  Both of them have somewhat spotty charts and VOCL has quite a small trading float (about 6 million shares) so it’s moves can be fast and sharp in both directions.  (click on each chart to see full size)

Read more

ETFC Etrade Breaks Down and Cannot Get a Rally Going

etfc20090807

Have you noticed how a lot of financial talk shows or internet sites seem to never mention the stocks or setups that turn sour?  Or maybe they only talk about the winners or how much percent they are up for the month or year.  I actually think it is a good idea to revisit setups that failed and then to try to figure out what went wrong or why it did not work out.  If we don’t learn from the failures then how are we to learn about what makes a good setup versus a bad one ?

Etrade ETFC is a failure.  I don’t mean their business is a failure.  The setup I initially talked about is.  Etrade Financial broke down today on pretty heavy volume and this on the same day the rest of the market was up very strongly.  I don’t like to see a break down like this in light of such market strength today, and also to see it with such heavy volume.

Read more