GLD ETF breaks down below rising channel

gld20090817

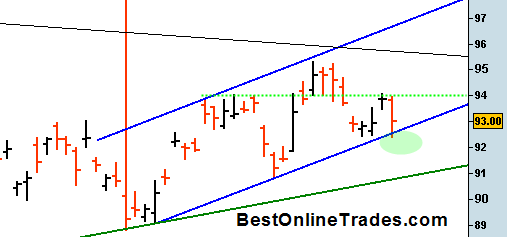
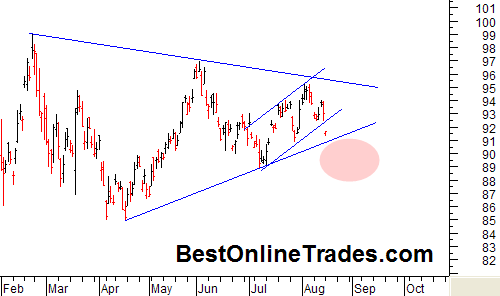
The GLD ETF has broken down below the short term up trending channel which was leading to a breakout out of this large symmetrical triangle pattern.  Gold clearly wants to test everyone’s patience and throw another curve ball at us.

The break down in the GLD today coincides with a breakdown in the broad market and a big move up in the US Dollar.  The GLD is still within the large symmetrical triangle and it is looking like it will come down to test the bottom of this symmetrical triangle.  I really would like to see it hold. 

If it does not hold then something else is going on in the gold market and I may have to rethink bullish possibilities.  I would like to see the GLD ETF hold above the 90 level and most certainly above the 89 level for me to still stay constructive on this market.

Read more

Emini S&P 500 Futures Down Significantly this Morning

sp50020090817

The Emini S&P 500 Futures are down by over 20 points this morning.  That is the most I have seen them down in the morning for maybe the last month or so.  So it seems we could finally have a real correction to the downside kick in during the last two weeks of August.

I am still seeing a decent amount of upside setups, but this possible downward bias in the S&P 500 the next couple of weeks is worth noting and probably makes it prudent to be more defensive and shorter term the next couple of weeks.  There may be more failure breakouts and continuation breakdowns in individual stocks and the indices for the rest of August.

Read more

A Couple Quick Mentions of ANPI and EPEX

Someone sent me a quick mention of ANPI in the submit news link at the top of the site here.  They indicated that the pattern was similar to the CTIC stock setup that I mentioned yesterday.  I just wanted to be sure to pass this info on to you and only make a few quick comments.

My quick take on ANPI is that yes it is similar, but for now I still think that CTIC has the stronger pattern and a cleaner pattern.  ANPI at first glance seems to have had a larger retracement and a somewhat more scattered triangle.  Anyway, no in depth analysis here but wanted to pass this info.  Maybe I will do a short write up of ANPI this week if it has merit.

I believe the same person also reminded me that EPEX was beginning to break out of pattern that I had written about before.

epex20090816

Read more

BestOnlineTrades may Focus Exclusively on CTIC Cell Therapeutics

ctic20090815

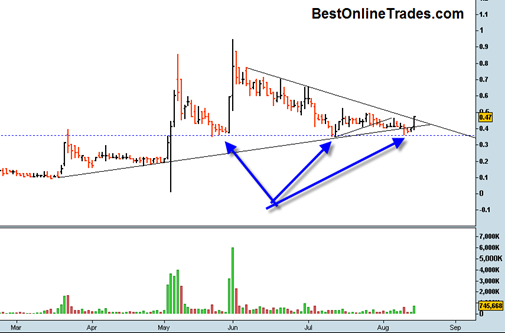
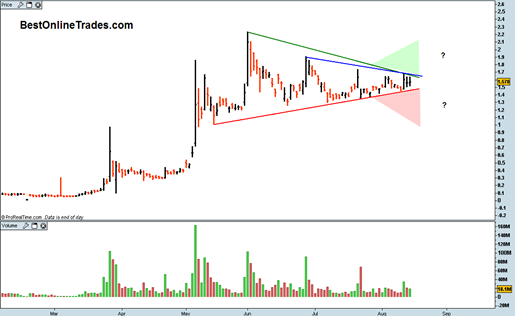
I hate to turn BestOnlineTrades into a ‘one trick pony’ for the next couple of weeks, but I may spend a lot of time covering CTIC Cell Therapeutics in a multi part series.  I will still cover some other topics as well, but I would rather focus in like a laser on CTIC and see what can be learned about its behavior and possible outcomes.

The chart of CTIC is notable for several reasons.  It clearly has a solid uptrend with very respectable advancing volume since the March 2009 time frame.  So it has shown us a clear sign of strength off of a major bear market bottom.  This is important because it helps to give added probability for possible future price direction.

Also notable is the fact that CTIC has consolidated sideways for roughly 3 and a half months AND it has not given back too much in the way of price. In other words, price has held relatively firm during the consolidation instead of slanting down or going into a deeper retracement.

Read more

Don’t Ever Feel Bad about Making 5 Percent on a Trade

It took me a long time to learn this and to be honest I still have not 100% learned this principle.  What am I talking about ?

I am talking about that feeling you get when you enter a trade, it starts to go your way and you sell ‘early’ taking your 5 or 10 percent only to see the stock zoom higher onto much bigger gains.  So then you might start the ‘coulda shoulda woulda’ syndrome where you start to regret the fact that you jumped out too early or made a mistake in your judgment.

This has happened to me many times and each time it happens I almost have to pinch myself so that I remember that THERE IS ALWAYS ANOTHER TRADE OUT THERE.  There is no reason to feel bad about making 5 or 10 percent even if a stock goes on to make 200%.  Why? Because there will always be more opportunities for other entries and setups that are just as good or better.  Sometimes they do not show up that often, but eventually they will come and you will be there to pounce on them.

Read more

BestOnlineTrades Nails the CORS Trade

cors20090814

I am putting this post in the ‘trading flashback’ category.  It is a category where I look back at trades I have talked about and try to introspect as to why they either failed or succeeded.

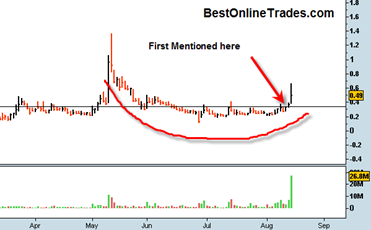
I first mentioned CORS Corus Bankshares on August 12th in the evening.  It was trading at .33 cents at end of day August 12th.  Today we hit an intra day high of .65 or almost a full 100% move in just two days.  Clearly this is the power of penny stocks and outsized potential returns, but with added risk.

On my first post on CORS I said and I quote:

First CORS needs to get above .33 and close up above that level.  I would prefer to see a full price bar above .33 as a signal that a big pop could start.  I think we have a good shot at the beginnings of a breakout type move tomorrow and then maybe a low volume pullback Friday, and then the real run early next week sometime.

As it turns out the run did not wait until next week.

Read more

GLD ETF slightly Pierces Uptrend Channel

gld20090814

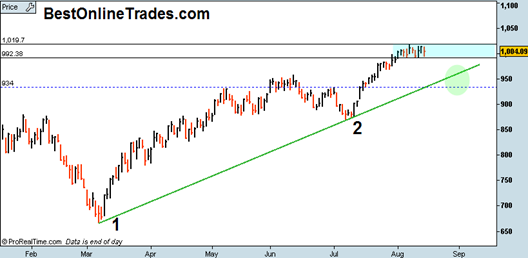
The GLD ETF slightly violated the blue uptrend channel I have been talking about this week.  The close was inside the channel however and the volume on today’s decline was really light.  I don’t like the fact that we slightly pierced the channel today but for now it is not the end of the world.

Within this up trending channel there is a slight tendency to an ascending triangle pattern with the green dotted line being the supply line and the bottom blue line being the demand line.  If I am correct in that assessment then it implies that there is not too much room left in the apex of this ascending triangle and either the pattern fails or we get a topside breakout out of the pattern which would have measurement implications within the critical upside breakout area.

Read more

Is a Sideways Correction the Worst the Bears will Give us?

spy20090814  The SP500 was down on this Friday the second week of August.  But am I surprised? No. Not really.  This is about the time that traders head for the beaches. Plus it is starting to get way too hot and humid outside to be sitting in a room in front of the computer all day.  So a good bunch of them probably just sold to cash today and headed for the beach or the pool or for their favorite ice chilled beverage of choice.

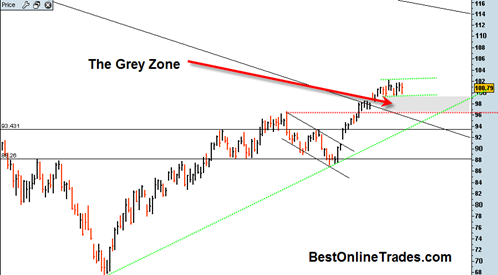
All the bears could manage today was another down day within the smaller green channel I have drawn in the chart.  I am still open to the possibility of 95 on the SPY ETF as a normal corrective retracement and testing of the breakout area.  It would get us into the ‘grey zone’ so to speak and help correct off some excesses.

Read more

UNG Natural Gas ETF Cannot get the Job Done

ung20080813

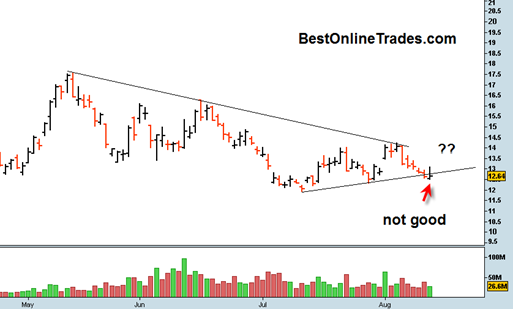
I talked about the UNG ETF several other times and at this point I am going to just have to put it in the freezer for while.  The trend has been relentlessly bearish.  I thought a couple of weeks ago that the UNG Natural Gas ETF would be able to get some sort of spike rally higher based on the monthly chart because there were some weekly divergences building and the monthly chart was showing at least some promise of a reversal in August.

But as of today the chart looks weak and horrible.  Today and yesterday we briefly broke under trendline support and may warn of an impending break below which could be really bearish.

Read more