The TZA Direxion Russel 2000 3X Bear ETF the Best Online Trade for October ?

If you have read a few of my recent posts you know that I have become very cautious on the broad market now and am looking for a downward retracement and profit taking to commence soon. The weekly MACD is flashing major warning signals and is structured very similar to the first major down leg … Read more

S&P500 weekly MACD is Going to Nail the Top

sp50020090928

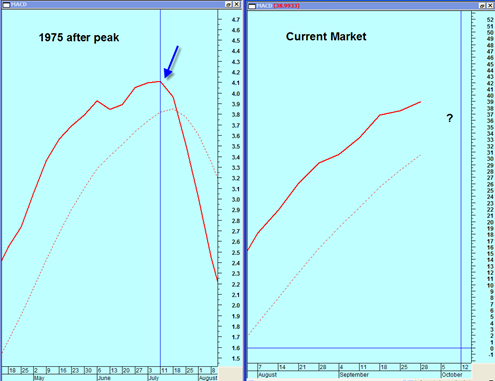
The chart above shows the weekly MACD plotted against the S&P500 for the 1975 period (left half) and the 2009 period (right half).  The downside weekly MACD crossover that occurred in the 1975 period was the first major turn in that market after a super sized rally that was in progress from the major 1974 bear market lows.

The weekly MACD is nice to use for turning points sometimes because it evens out all the extra noise and helps to identify more meaningful turning points.  Sometimes it fails during extremely persistent trends.

I have written a few times before here at BestOnlineTrades about the similarities between the current mega rally from the March lows and the mega rally that occurred from the 1974 bear market lows.  The likeness is quite surprising and if the similarity continues then I expect we will get a bearish downside crossover on the weekly MACD similar to what occurred during the 1975 period that led to an eventual approximate 15% downside correction and then went into a 5 to 6 month basing period.

The current weekly MACD has not turned down yet and it has not achieved a crossover yet.  But I think we are close.  I calculate that the cross should occur within the next 1 to 3 weeks, most likely by mid October.  For the weekly MACD to start turning down so that the MACD signal line gets close to crossing the moving average line (dotted line), we need to see in the week ahead and the week after price CLOSES that are not much higher than the recent all time highs.  Preferably we want to see price closes that are in the current S&P500 trading range for a week or two.  That would help this weekly MACD towards a bearish cross.

The mid October time frame is consistent with Terry Laundry’s latest T Theory Update. (He has an audio update and PDF chart that goes with it).

Read more

Am I Too Early on the Short Trade ?

I have a feeling that the ‘early shorts’ are going to get burned in the next week or two.  This market has shown itself to have a lot of very strong upward momentum and to turn minor corrections into pop up rallies. I was studying once again the 1974 and 2009 massive automatic rallies and … Read more

Bounce Next Week for the SP500 ?

sp50020090925

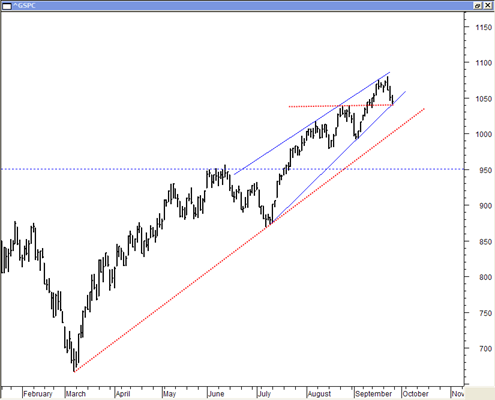
I would have to describe the decline so far in the SP500 as ‘labored’.  I am not seeing panic or a total loss of price support at this point, instead just a slow and steady profit taking move.  The chart in this post shows that the SP500 is at the close of Friday sitting right on the steep blue uptrendline support and also at the minor horizontal support as defined by the red horizontal dotted line.

I am thinking that whatever type of decline we get in the weeks ahead may not be rapid or involve very large one day percentage moves like we saw during the 2008 period.  The reason for this is that we are just now coming off of an extremely overbought market and slowly transitioning to a mini bear leg. We are still trading above key moving averages and still to large degree the bulls are in control.  That is the mindset I am trying to keep right now because I don’t want to be too aggressive on the short side. 

I have a feeling that the coming decline in prices is going to be slow, labored and to be honest somewhat boring, especially when compared against the 2008 extremely rapid price declines.

Read more

Superb Shorting Opportunities Developing Now in the SPY ETF and Elsewhere

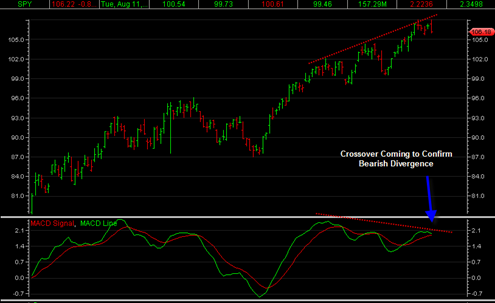
spyetf20090924  The SPY ETF got some bearish downside continuation today from yesterday’s key reversal day on heavy volume.  The bulls tried to get a rally going many times throughout the day to try to create a price swing reversal bar but failed to accomplish anything meaningful by the close.

Volume came in heavy again on the downside on the SPY ETF at least relative to the upside volumes we have been getting over the last month or two.

Tomorrow’s action is key because it will create the closing weekly price bar on the SPY ETF, and if we close near the lows tomorrow or at least have a decent down day then it will create a bearish looking weekly reversal bar which will be the first one since June 14th, 2009, the time period of our last more extended correction.

Then next week the first three trading days of the week will finish off September and will create the closing monthly price bar on the SPY ETF.  If we get enough price destruction the next 4 trading days then it may even set up a bearish looking MONTHLY price bar on the SPY ETF which could potentially signal more bearish continuation into a good part of October.

I suspect this will be the case because I am already seeing the bearish divergences play out and generally the price destruction starts slow and then gets to an acceleration point after the bulls finally give up.  But we will have to see how the weekly and monthly price bar closings come in during the next 4 trading days.

Read more

The SP500 Topped Today and it is Time to be Bearish

spyetf20090923 The market topped today in my opinion and caution is advised for the next few weeks as I think we are in for some pretty severe downside.  There were plenty of significant reversals today and it looks like the SPY ETF showed a bearish engulfing candlestick pattern on heavy volume.

The structure of the market right now is still setup in a bearish divergence when we compare it to the pattern of the MACD.  It says that we should now have at least a month of downside price action with a few intermittent rallies in between.

Almost everything reversed today and a lot of the indices look bearish now whether it be stocks or commodities.  There are bearish divergences all over the place.

Read more

I Will Stay Bullish On Spot Gold as Long as the Break Out Area Holds

spotgold20090921 The GLD ETF declined today on what I consider to be light volume.  I think it is going to go into a sideways consolidation this week with an outside chance of a sharp reversal move up topside later in the week.  The setup still looks contructive to me on both the GLD ETF and the spot gold price.

In the chart above as long as the spot gold price holds above the 988 level which is approximately where the long blue key support line is, then I will remain BULLISH on gold for the rest of September and the last 3 months of this year.  Spot gold already did the job of breaking above this line on big volume, but not blockbuster volume.  We could pull back all the way to 990 and I would still be bullish. 

It is possible that we could enter a sideways trading range for some time but we do still have the very bullish seasonals until the end of this week and at various other time frames into the end of this year.

Why be bearish on spot gold if the chart is not telling you to?  The charts do not lie and I am not going to doubt this spot gold price chart.  Obey and stay above the breakout area, then I am happy to be a gold bull.  Break under it, then something else is going on and the bull case is delayed.

Clean. Simple. Effective.

Read more