SP500 Yearly Candlestick Chart Shows Bullish Bottoming Tail and Range

sp500yearly

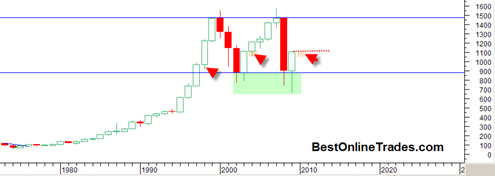
This is a very interesting candlestick chart of the SP500.  It is the YEARLY price candlestick long term chart.  There are few interesting things we can see from this chart.  The most obvious is the very clear long term trading range almost 10 years long.  Despite all the bears endless preaching the fact is that so far at least the market has not been able to break DOWN out of this trading range and therefore keeps the cause building consolidation case intact.  The longer the market trades within this large trading range without breaking down under 900, the better argument can be made that eventually it will break topside.

The other thing to note is the current 2009 yearly candlestick.  This massive yearly candlestick has a large bottoming tail which indicates the strong demand that came in and held prices within the trading range.

Read more

Penny Gold Stock CVRG Converge Global Continues to have Bullish Tendencies

CVRG20091206

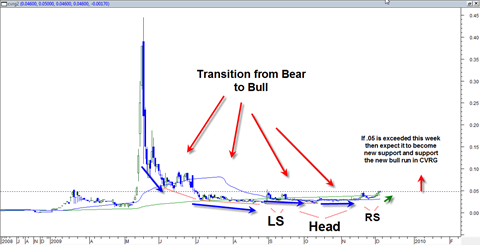
The overall chart structure and historical trading pattern and current trading action in the .046 cent gold mining penny stock CVRG Converge Global continues to look good for this beginning week of December the 7th.

My weekly indicators are telling me that this week that begins December the 7th is a possible breakout week for CVRG.  CVRG has the opportunity this week to make a breakout north above the critical .05 cent level.  A breakout here would come from a 3 month head and shoulders bottoming formation that is astoundingly symmetrical.

That head and shoulders bottoming formation could also be the last basing formation CVRG does as it may now be ready to start the mark up stage.  The blue arrows I have drawn in the chart show how CVRG has had progressively less and less selling pressure which is evident from the slope of the declines being less and less until they got to the point where CVRG basically traded almost completely horizontal during the October time frame.

Read more

A 2 Year Correction for the Dow Jones Industrial Average ?

Thomas Bulkowski of the pattern site thinks the DJIA could be close to entering a 2 year correction starting pretty soon.  It is a nice post and lays out a few arguments why this may be the case.  After that he says the market could take a shot at the old highs.

In general I agree with him. We are getting close to the time for an extended correction.  Whether or not it will be two years long is unknown to me.  I was thinking earlier that it could be maybe 6 to 8 months long.  Either way a sideways to down correction like that would go a long way towards working off the overbought condition of the market and help build cause for the next move.

In other news I am keeping an eye on SQNM Sequenom.  It appears to have a nice ascending triangle and might get some kind of run going next week.  But on the other hand looking at the history of the stock the ascending triangles have not proven all that reliable and it is worth noting that SQNM is a biotech stock and has shown some very wild and scattered price action in recent years. 

Read more

The Gold Price and GLD ETF Takes a Big Body Blow Today

gld20091204

Gold is getting hit bad today and if you look at the dollar amount on kitco.com it looks a lot worse than if you just focus on the price chart.  The GLD ETF was overdue for some type of consolidation and using the employment report news today seemed like a good enough excuse for the big money crowd to slam it down.

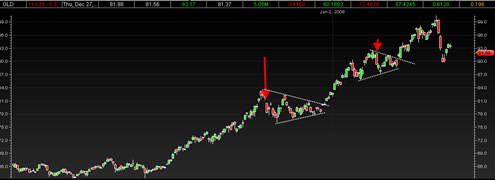
Right now my take is that we are going to enter some type of sideways consolidation perhaps a month long before going higher again.  I say that because I think today’s price destruction in the GLD combined with the huge volume should be enough damage to start a trend change/ and or consolidation.

The chart above is the GLD ETF in the 2007 to 2008 time frame.  The red arrows point to heavy selling days that damaged the up trend enough to get the GLD into consolidation mode for a while.  So I am expecting something similar to what occurred in the chart above.

Read more

What is the SP500 Index Going to Decide from Here?

sp50020091203

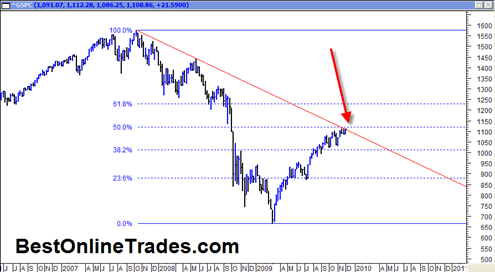
I would be completely remiss if I did not point out once again the important juncture the market finds itself in right now.  The chart above is one which I believe LOTS of people are focusing in on right now.  Why?

Well because the chart above (by the way, it is the weekly price chart) helps to summarize the market in a nutshell and defines some very important parameters that could be very key going forward.

First, it shows the entire extended bear market leg from 2007 into 2008 and then the current massive retracement higher right up to the red colored down trend line that defines this bear market.  So we know that the market at least as defined by the SP500 is perched right under long term resistance.  We also know that this is the THIRD attempt back up to the red down trendline.  The fact that it is the third attempt can be important because usually you will get a successful breakout on third attempts.

Read more

Is the Next Major Top in Gold and the SP500 Really Going to Be This Simple ?

euro20091202

usdollarindex20091202

A lot of market analysis sometimes boils down to some very simple analysis.  But we humans try to make market analysis as sophisticated and complex as possible to make ourselves look smart and feel important.

But could it be that the next major trend change or at least consolidation and retracement be due to the two simple charts above?  I think it could very well be.

The Euro is trending higher on a solid up trendline and appears to be close to the point of some type of final blow off run into that red zone I labeled in the first chart above.  Conversely the US Dollar appears to be headed into that red zone of support, perhaps also in ‘blow down’ fashion.  When either the Euro or the US Dollar Index hits those zones I would logically expect some type of big downward bounce in the Euro and upward bounce in the US Dollar Index.

When they get into those ranges I would think the powers that be (central bankers worldwide) would start making a lot of noises that their currencies have gone ‘too far out of line’.  So that type of thing could cause some huge bounces and break downs and it will probably coincide with them hitting those red zones above.

Read more

Gold Mining Penny Stock CVRG Converge Global Setting up for a MoonShot

Before I even begin to talk about CVRG let me say this.  CVRG is a PINKSHEET penny stock that is extremely speculative and has all the normal disadvantages that normally come with pink sheet stocks.  I consider penny stocks in some ways less risky than options because they do not have time decay, premium and expiration, but that does not mean they still cannot cause major heart ache.

I made a decision a while back not to talk too much about pink sheet penny stocks here at BestOnlineTrades because they are an entirely different animal and just do not seem appropriate to mix in with all the other ‘big board’ topics I cover here.  But occasionally I make an exception and I am doing that now.

So having said that, and since I have free editorial reign here at BestOnlineTrades I want to tell you about CVRG, Converge Global.  It is a pinksheet gold mining penny stock.  The ONLY reasons I think CVRG could become a nice play for the next 2 to 3 months are because of the technical setup that exist within CVRG and also the backdrop of a parabolic exploding gold and silver price.

We have already seen a number of gold mining penny stocks blast higher in recent weeks and I expect this trend to continue.  SGCP (Sierra Gold Corp) up 900% from its recent lows, BRYN (Bryn Resources) up 4042% from its recent lows, KATX (Kat Exploration) up 1035% from its recent lows.  So clearly speculation is ripe and the gold mining pinksheet penny stocks are on fire and in heavy demand.  Part of the reason for this is simply a matter of supply and demand.  There are so few gold stocks to choose from that what you will see is ‘gold money’ funnel more easily into the micro cap gold mining plays on pure speculation and lack of other choices.

Read more