AIB Allied Irish Banks and LYG Lloyds Banking Group PLC (ADR) Still Bullish

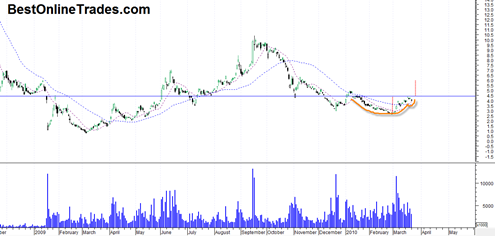
Both of these bank stock charts are still looking bullish to me for more potential upside in the week(s) ahead.  The attraction of AIB is that it is late in the recovery compared to many US banks, but still the price chart has some positive aspects to it in my opinion.

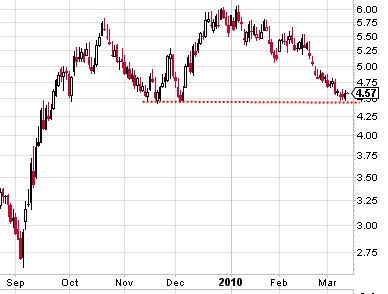
For starters, it has what looks like a double bottom that has about 1 full year distance between the potential bottoms.  The substantial distance between the potential bottoms is a good technical setup that could have a lot of potential significance from a longer term perspective.  The double bottom is not a confirmed double bottom.  I am just trying to make an ‘early call’ that it will be one as we go forward.

AIB appears to be testing a resistance range and has recently stalled there.  There is some slight resemblance to a cup and handle pattern developing that could send AIB to the 6 range assuming we get a northward breakout this week or next.

aib20100322

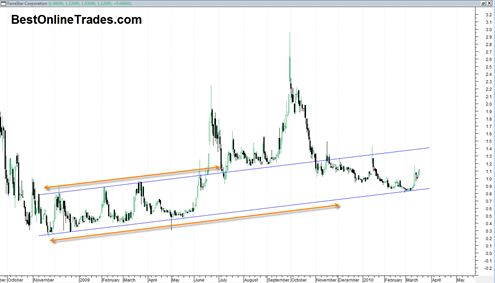
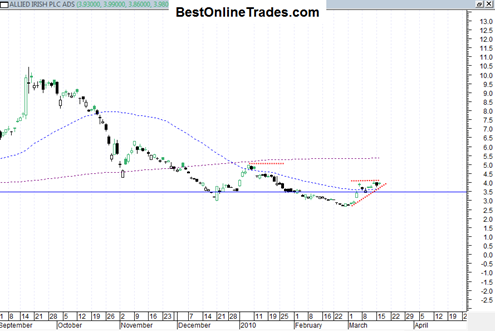
Similar to AIB, LYG Lloyds Banking Group, another ADR (England) appears also to have a quite bullish looking setup for a breakout north through resistance soon as well.

Read more

Las Vegas Sands Corp. (LVS) Weekly Price Chart Looking Very Good for a Breakout

lvs20100317

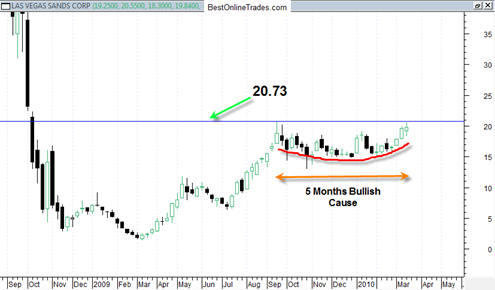
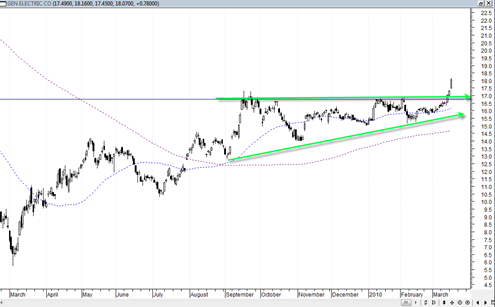
Las Vegas Sands (LVS) the casino and gambling co. has what I consider to be a very bullish looking weekly candlestick chart.  It is interesting that the basic structure here is somewhat similar to the way GE General Electric looks and GE recently managed to get a substantial sign of strength breakout on huge volume.

The challenge for LVS is to get a sign of strength weekly price breakout over and above the 20.73 level.  The price chart shown above has a lot of sideways cause and is a bullish sign for supporting an extended weekly breakout.

Assuming a breakout (perhaps next week sometime ?) a quick retest back to the 21 area would be expected and preferably on low volume.  The sideways pattern of the last 5 or 6 months resembles a saucer formation.

Read more

Kicking Myself for Missing the CAGC China Agritech Inc Put Option Trade

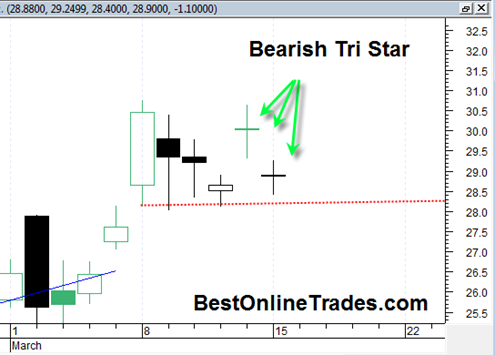
I really hate it when this happens.  I a couple days ago I wrote about the rare bearish tri star candlestick formation that had formed in CAGC after the enormous 130% + percent run up in only 1 months time frame.  After I wrote about it, I took a little bit of time to see what the March Put Options were doing on CAGC.  I was eyeing the March 25 out of the money put on CAGC which at the time was trading somewhere near .20 a contract.puts

So then I was thinking to myself how great a potential short term trade this would be in CAGC if it could somehow get to 25 or at least close to 25.  But then I started doubting the trade since it only had till the end of this week till expiration and I feared that the bearish tri star would not evolve into a bearish follow through soon enough.  And I really thought it would be a long shot for CAGC to get all the way to 25 with only a few days remaining until expiration.  Also in the back of my mind was the persistent resiliency of CAGC and its ability to hold up strong.

In the final analysis my little fears and doubts and failure to pull the trigger on this trade (ie. actually taking the trade) was a big mistake because it ‘could have’ led to a 400% to 800% profit in only 2 or 3 days !!!

Read more

Another Potentially Huge Trade Developing in Gold or the GLD or DGP ETF

It is time to start paying serious attention again to the gold market and the gold price.  One of the things that fascinates me the most about markets is their ability to get people to essentially ‘fall asleep’ and basically forget about the previous excitement that was in full force.

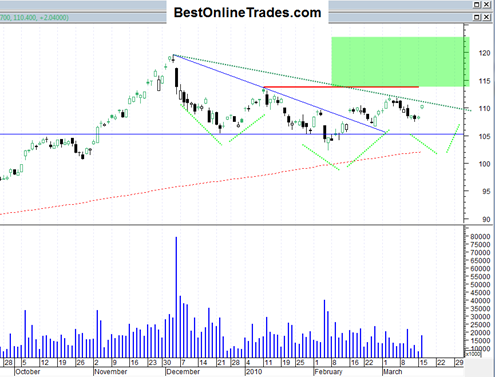
The excitement I am referring to was the persistent run in the gold price towards the 1200 range.  That was a huge move and a very nice persistent move.  But since that early December 2009 high, the gold price has drifted sideways to down and held up remarkably well considering how strong the US dollar rally has been.

But once again I think the GLD and the DGP are worthy of close monitoring.  More specifically the GLD breaking above 114 would be for me a key event and signal that the gold price wants to get another big move towards 1400.  But the GLD ETF must be able to get above 114, otherwise it could drift sideways for another month or so to complete this consolidation.

gld20100316

Read more

China Agritech Inc. CAGC forms Bearish Tri Star Candlestick Formation

cagc20100315

CAGC the absolutely MASSIVE momentum China Stock Play that has been performing like a true champ, today finished forming a potential pattern that should provide a halt to the rocketing share price.

The pattern is the bearish tri star candle stick pattern.  The pattern consists of three candlestick doji’s in what looks like a tri star formation and there exists gaps between the top doji and the two bottom ones.

Now I gotta tell you, I would be the last man on this earth to recommend shorting a super strong momo China Stock like CAGC.  However in only 1.5 months CAGC has managed to rise 144% which is astounding.  That kind of move is unsustainable and in most cases needs some kind of retracement before it can continue higher.

Read more