SP500 creates high volume candlestick continuation DOJI Today

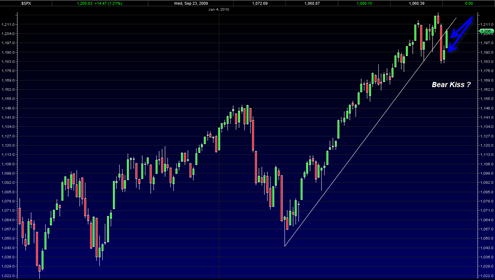
I think today is simply a mid point type move of the first leg of this correction.  It just does not feel like the bottom yet.  If we had a high volume reversal hammer today then I might say that we are ready for a nice big bounce topside.

Instead we got an indecision doji candlestick which was also on almost the same volume as yesterday.  That tells me that the market is simply digesting the recent minor support area and while it may go sideways or slightly up for a day or two, I expect soon thereafter another big body blow to the downside to create a mini exhaustion type move.

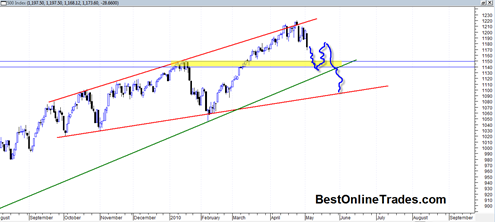
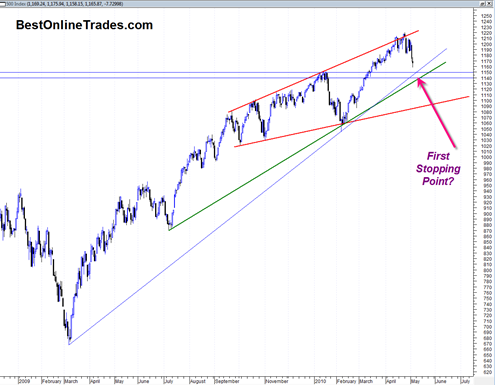
After reviewing my charts I can clearly see that 1140 on the Sp500 should be the start of a violent bounce to the upside.  I am hoping we print that level either tomorrow or Friday as a means to close out shorts. I have not decided yet whether it will be worth it to play the upside bounce but for now these are the guideposts I am looking at.

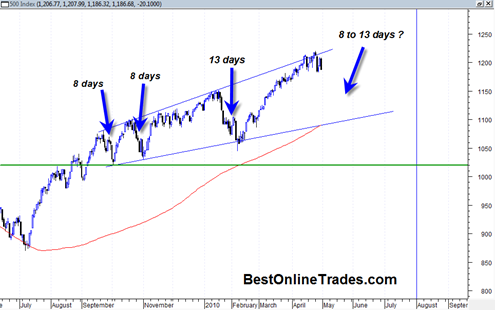
Assuming I am correct that we get a good bounce going from 1140 then I would expect the peak of the next reaction rally to serve as a pivot point to trade back down to the bottom side of the ascending broadening wedge (the solid red lines in the chart below).

Read more

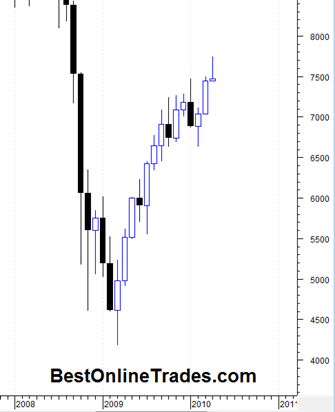
New York Composite Index Reveals a Monthly Gravestone Doji

If you have been reading posts here at BestOnlineTrades then you probably already know that I am ‘looking for’ a price movement that has less resistance on the downside rather than upside (note: I am purposely trying to avoid using the terms ‘bearish’ or ‘bullish’ because of the inherent emotional bias it can build in … Read more

Stock Market has Switched into Overdrive

The market has switched into total overdrive with the weekly RSI reading currently showing 72.62 above the critical 70 line.  BestOnlineTrades has been correct in maintaining the stance that this reading should be perceived as internal market strength and not a sudden reason to short the market.  The path of least resistance remains up and … Read more

Hanmi Financial Corp may do a continuation breakout soon

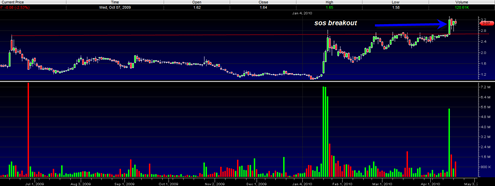
HAFC has recently broken out north out of a quite large ascending triangle formation and has done so with a wide price spread and heavy volume, confirming it.  The volume was slightly less than the highest volume swing in the previous range and so that is somewhat of a concern.  However at least for now … Read more

China Agritech Inc Pulls back to the bottom of the broadening wedge formation

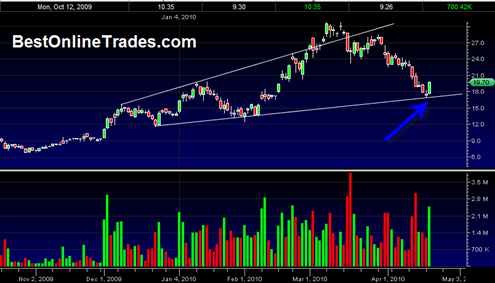
China Agritech Inc CAGC has pulled back all the way to the bottom of its broadening wedge formation and it did it a lot sooner than I thought it would.  I indicated in a previous post that China Agritech has a habit of being just as volatile on the downside as to the upside.

CAGC was way overdue for some type of pullback given its recent 130% super move in just a month and a half to the upside.  Then some insiders started selling and I believe gross margins started to slip a little bit and so people started dumping shares.  It is probably a true statement to say that when any company gets near a 500 million dollar market cap it enters a new juncture where it must prove itself and show that it is ready to enter mid cap land and be able to continue to sustain growth despite the competition.

I don’t know whether this will be the case.  But I do know that CAGC has touched the falling wedge support and so far today has shown a nice price reaction off of this support.  The recent two candlestick bars also appeared to be a morning star candlestick pattern which is a reversal pattern.

Read more